Session Information
Session Type: Poster Session B
Session Time: 8:30AM-10:30AM
Background/Purpose: The Western Ontario and McMaster Universities Arthritis Index (WOMAC) pain score [range 0-20] is a common outcome measure for clinical trials and observational studies in knee osteoarthritis (OA). However, for early stage OA, the distribution of WOMAC pain is not symmetric, with many people reporting pain scores of 0, and very few high scores. Modeling non-symmetric outcomes with standard linear regression or t-tests can yield inaccurate estimates of association and prediction. We sought to determine whether alternative regression methods are better for modeling WOMAC pain scores for samples in early stage OA.
Methods: We analyzed WOMAC pain scores for the right knees of participants at the baseline exam of the Osteoarthritis Initiative (OAI) incidence cohort, which includes subjects at risk for symptomatic OA. We modeled the pain scores by fitting the following distributions to all participants: normal, log-normal, beta, and gamma. The log-normal and gamma distributions require values to be >0, and the beta distribution requires values to be >0 and < 1. To accommodate these restrictions, pain scores were transformed by adding 1 and dividing by 22 to range from 0.045 to 0.955. We assessed the best fits of distributions to the pain values visually, and with chi-square statistics comparing observed to expected counts after dividing the range into 10 intervals. We performed multivariable log-normal, beta and gamma regression including sex, age, and BMI as predictors of transformed pain values, and used the best fitting models to create 10,000 simulated datasets with pain score and predictor values distributed similarly to the OAI incidence cohort. We then fit log-normal, beta, gamma, and robust regression models to each simulated dataset with transformed pain as the outcome and age, sex and BMI as predictors. To measure regression accuracy and precision, we used the predicted mean on the original 0-20 WOMAC pain scale for each sex along with the 95% confidence interval coverage, average confidence interval width, bias, and mean square error of the predicted means.
Results: We included data from 3,282 individuals, 41% of whom were male, with an average age of 61.3 (SD 9.2) and BMI of 28.1 (SD 4.6). The median WOMAC pain score was 1.0 (interquartile range 0.0, 3.0). The normal and log-normal distributions were poor fits to the pain score data, while the beta and gamma distributions were better fits, both visually and from chi-square statistics (Figure 1). When simulated datasets were created using parameters from the beta regression, all of the regression models slightly under-predicted the true mean of WOMAC pain score for both males and females, but the beta regression resulted in highest coverage, shortest confidence intervals, and lowest mean square error (Table 1). Results were similar when simulated datasets were created using parameters from log-normal or gamma regressions.
Conclusion: Standard methods used to analyze WOMAC pain score data rely on assumed distributions that may poorly fit the data. For creating regression models to predict the WOMAC pain score, beta regression may have better statistical properties than either normal or log-normal regression.
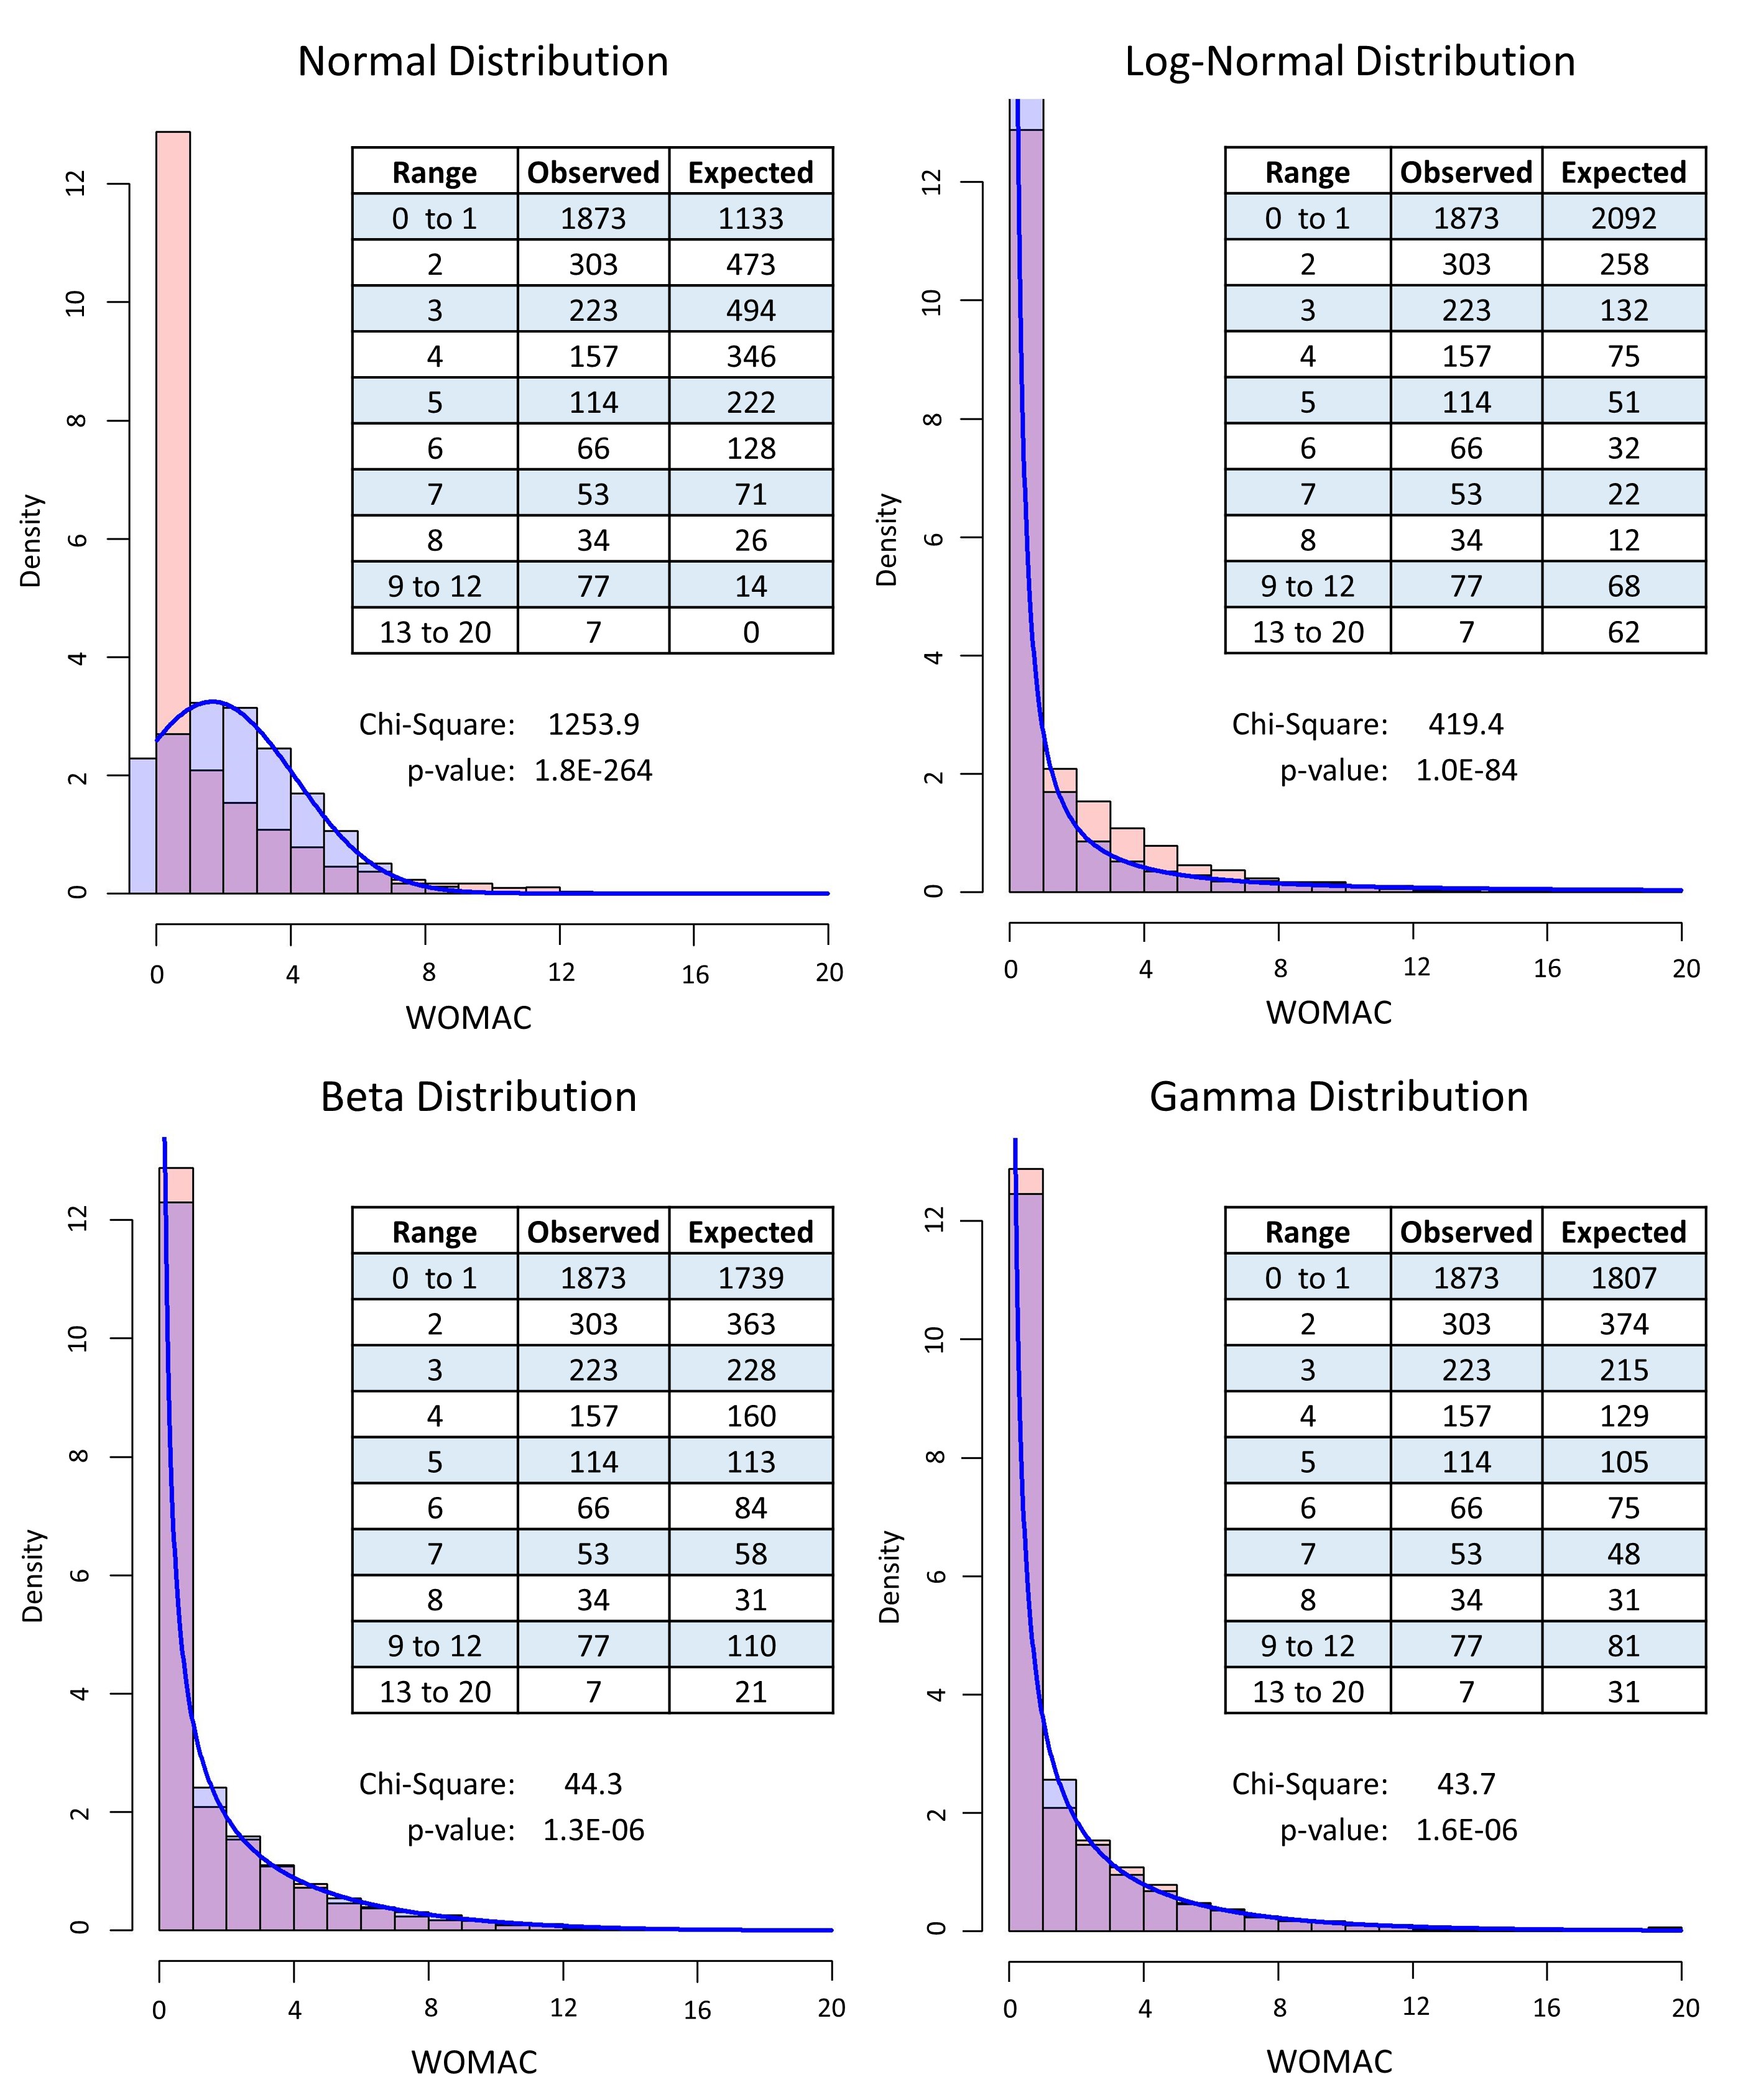
Red = Actual OAI data; Blue = Fitted data; Purple = Overlap

To cite this abstract in AMA style:
Sweigart B, LaValley M. Regression Methods for Modeling Western Ontario and McMaster Universities Arthritis Index (WOMAC) Pain Scores for Early Stage Knee Osteoarthritis [abstract]. Arthritis Rheumatol. 2021; 73 (suppl 9). https://acrabstracts.org/abstract/regression-methods-for-modeling-western-ontario-and-mcmaster-universities-arthritis-index-womac-pain-scores-for-early-stage-knee-osteoarthritis/. Accessed .« Back to ACR Convergence 2021
ACR Meeting Abstracts - https://acrabstracts.org/abstract/regression-methods-for-modeling-western-ontario-and-mcmaster-universities-arthritis-index-womac-pain-scores-for-early-stage-knee-osteoarthritis/