Session Information
Date: Sunday, November 7, 2021
Title: RA – Diagnosis, Manifestations, & Outcomes Poster II: Miscellaneous Aspects of RA (0786–0812)
Session Type: Poster Session B
Session Time: 8:30AM-10:30AM
Background/Purpose: Flares are an intrinsic part of the rheumatoid arthritis (RA) disease course and may impact clinical and patient outcomes. Severity, frequency and duration of flares matter, but the clinical assessment is limited by patient recall. Consumer technologies make it possible to capture and explore patient-reported flares in near real time. We used smartphone app data to explore the frequency of patient-reported flare weeks and their associations with various summary features of daily symptoms reported during the preceding week.
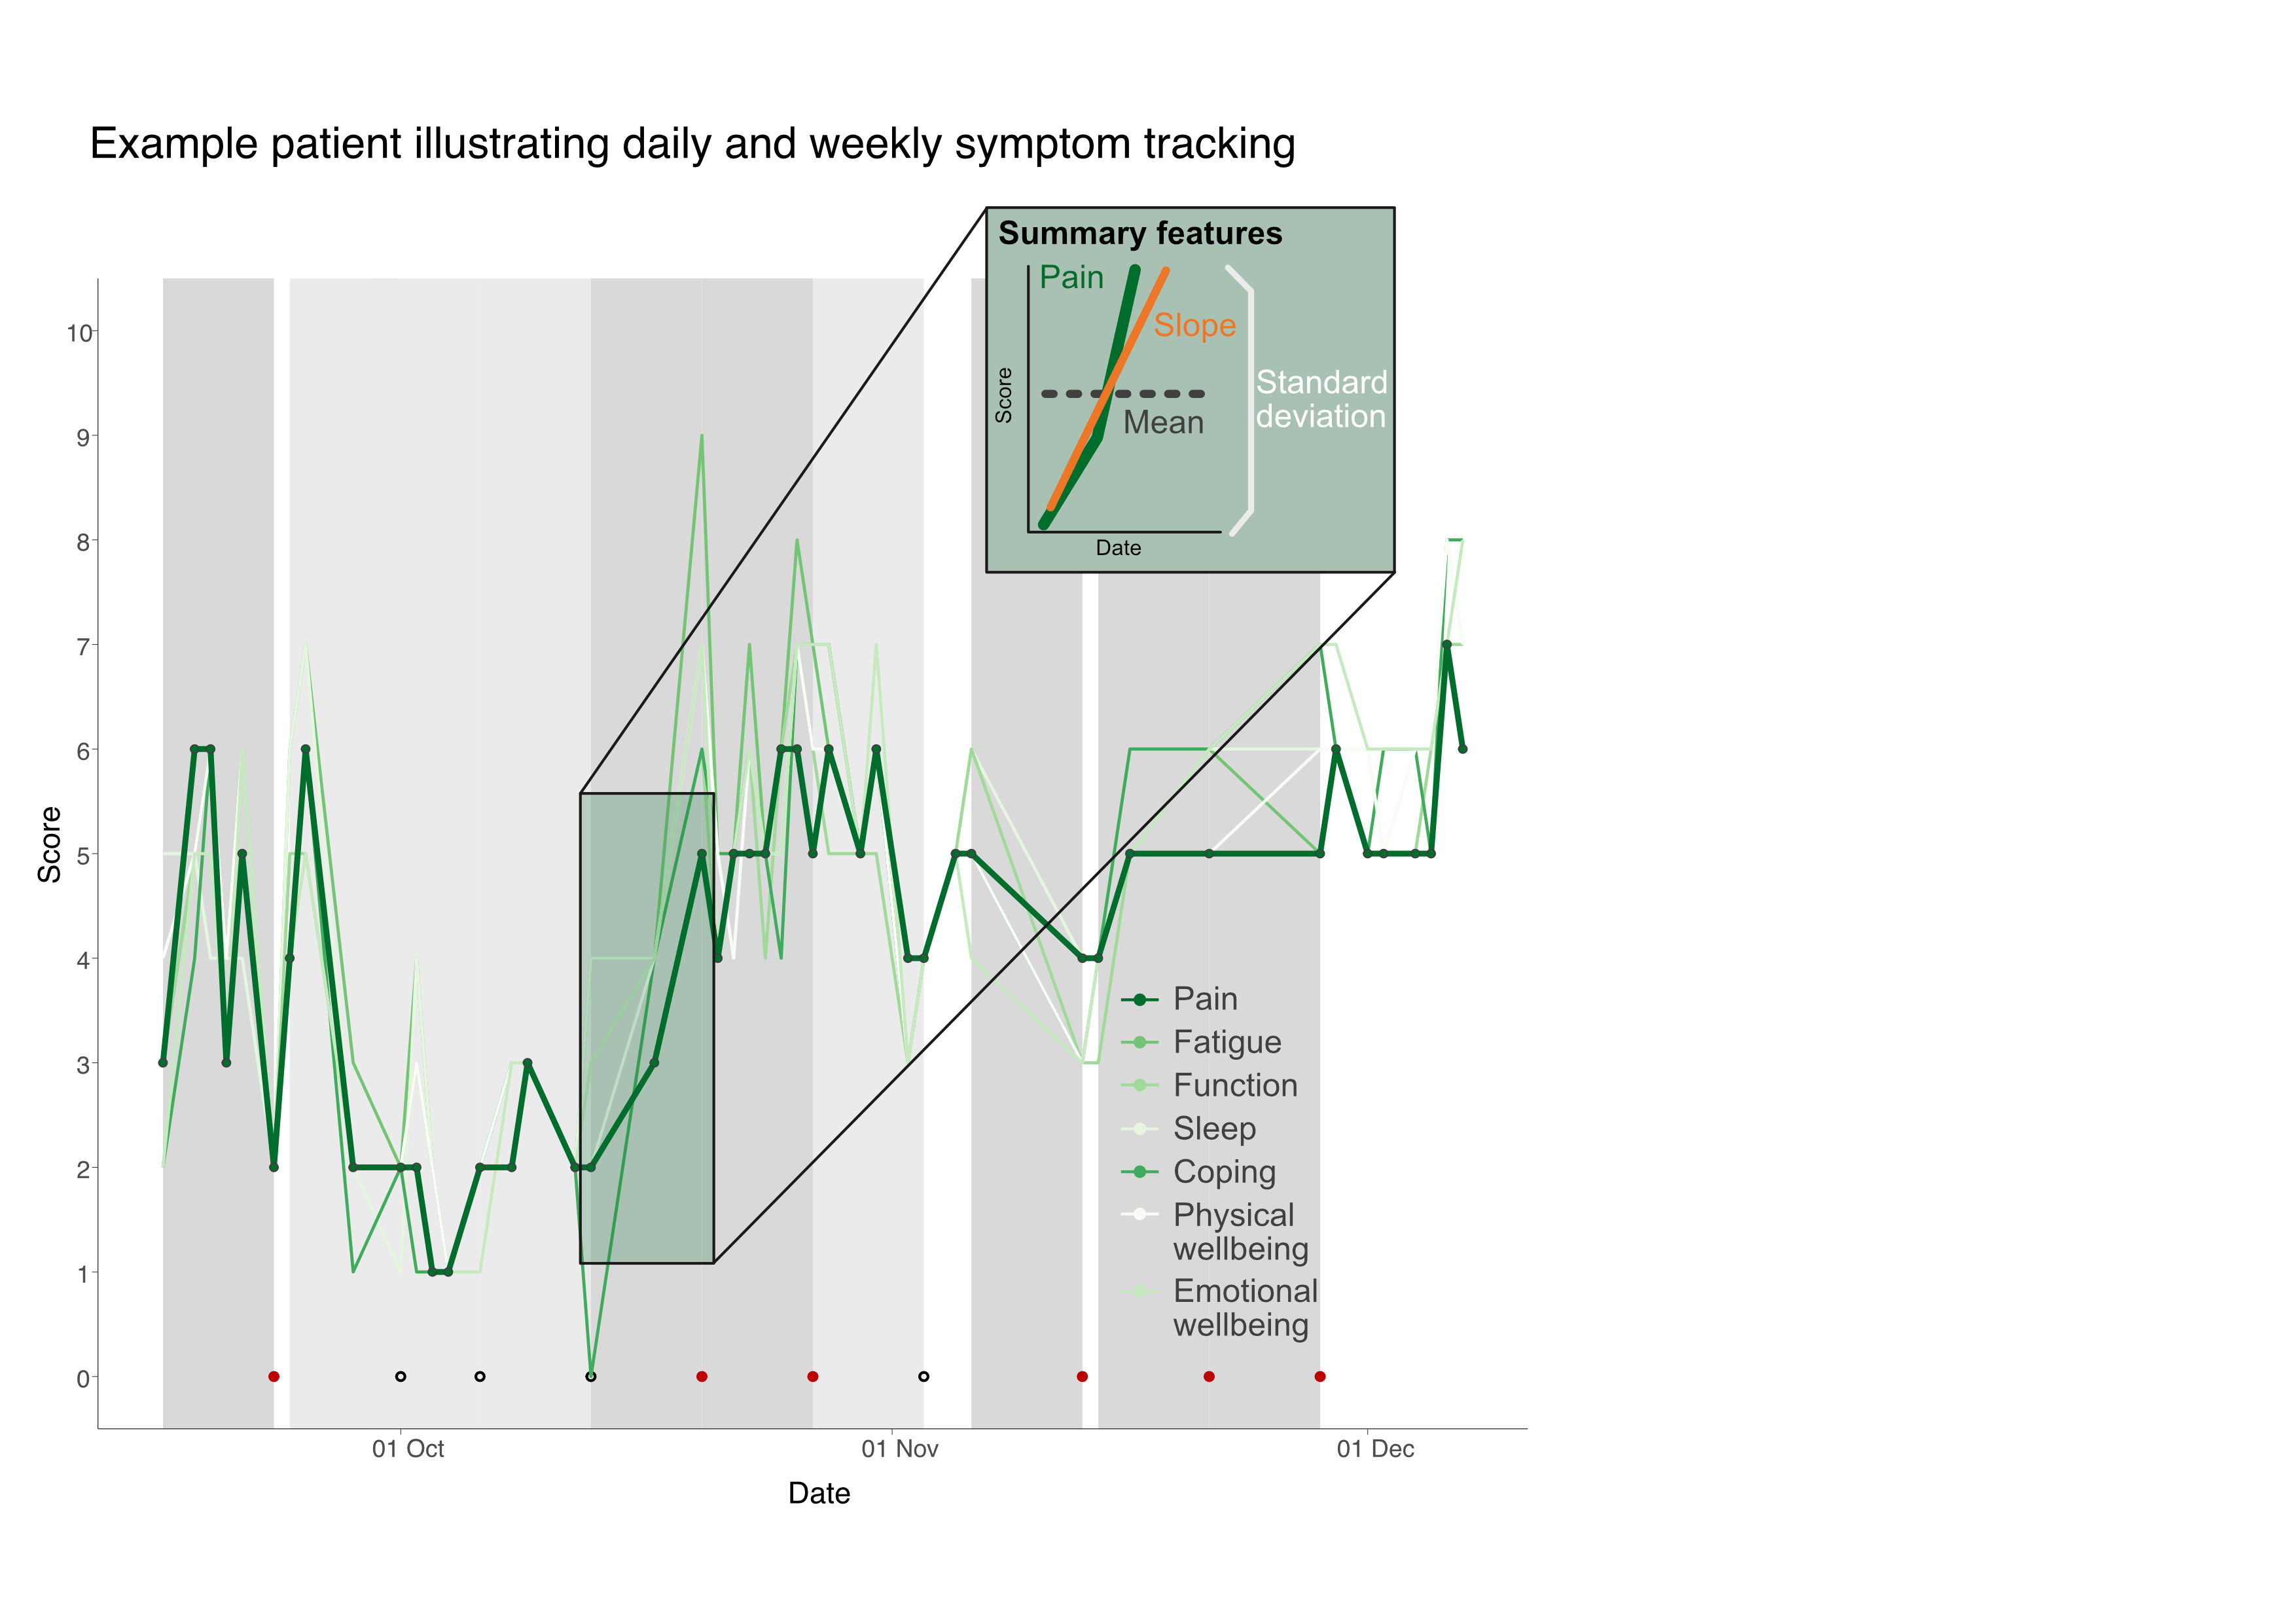
Methods: The Remote Monitoring of Rheumatoid Arthritis (REMORA) study aimed to improve monitoring of disease severity in RA. Patients tracked daily symptoms on a 0-10 scale (pain, fatigue, function, sleep, coping, physical and emotional wellbeing) and weekly flares on the REMORA smartphone app.
A flare week was defined as the seven days leading up to the weekly flare-question “Have you experienced a flare in the last week?” where the patient answered “yes” (Fig. 1). We summarised the number of patient-reported flare weeks. Symptom scores in flare and non-flare weeks were compared.
For each week prior to a flare question, we calculated the following summary features for all daily symptoms: 1) mean score, 2) standard deviation (SD), and 3) slope (Fig. 1, inset). Mixed effects logistic regression models quantified the associations between flare weeks and each summary feature.
Results: Twenty patients tracked symptoms over three months. 60% were female, all but one were white British, and mean age was 56.9±11.1 years. The median number of days in the study was 81 (interquartile range (IQR) 80, 82). We included 168 participant weeks. In total, 15/20 participants reported at least one flare week, with 54 patient-reported flare weeks in total. Participants reported a median of two flare weeks (IQR 0.75, 3.5).
In paired analyses, all mean symptom scores were significantly higher (difference on average 0.67 (SD 0.22)) in flare weeks compared to non-flare weeks except for sleep (p< 0.05). The SDs, a measure of variability, were slightly higher in flare weeks, but only significantly different from non-flare weeks for emotional wellbeing. For slope, there was an increase for all symptoms in flare weeks, although only the slopes of pain, physical wellbeing, and coping were statistically significant.
Due to strong correlations between symptoms, multivariate modelling of all symptoms and their summary features was not possible. Rather, we modelled pain as an example using each of its three derived features. In the full pain model, mean pain scores appeared to be more clearly associated with a flare (odds ratio 1.83 (1.15; 2.97)) than the change in scores in the preceding week.
Conclusion: In our RA cohort, self-reported flares were frequent. Flare weeks were broadly associated with higher scores (for mean, variability, and slope) across a range of daily symptoms in the preceding week, but the absolute value seemed more important than the change. The correlation between daily symptoms made it impossible to disentangle the contribution of individual symptoms to the flare experience.
Future analysis of daily symptoms may allow us to predict imminent flares, opening the opportunity for just-in-time interventions.
To cite this abstract in AMA style:
Gandrup J, van der Veer S, McBeth J, Dixon W. Using a Smartphone App to Detect and Characterise Real-Time Patient-Reported Flares in Rheumatoid Arthritis [abstract]. Arthritis Rheumatol. 2021; 73 (suppl 9). https://acrabstracts.org/abstract/using-a-smartphone-app-to-detect-and-characterise-real-time-patient-reported-flares-in-rheumatoid-arthritis/. Accessed .« Back to ACR Convergence 2021
ACR Meeting Abstracts - https://acrabstracts.org/abstract/using-a-smartphone-app-to-detect-and-characterise-real-time-patient-reported-flares-in-rheumatoid-arthritis/