Session Information
Date: Tuesday, October 28, 2025
Title: Plenary III (1722–1727)
Session Type: Plenary Session
Session Time: 9:00AM-9:15AM
Background/Purpose: The immunological basis of inflammatory arthritis (IA) immune related adverse event (irAE) following anti-PD-1/PD-L1 immune checkpoint inhibition (ICI) therapy is incompletely understood. The relationship between IA irAE and rheumatoid arthritis (RA) remain unclear. Furthermore, while both autoreactive T and B cells critically contribute to immunopathology in most RA patients, the existence of antibody independent arthritis has been suggested, but remains contentious. We aim to investigate the distinguishing immunological phenotypes between anti-PD-1/PD-L1 treated patients with IA irAE and those without irAE, and the relationship between IA irAE and serologically matched RA.
Methods: We analyzed a cohort of 163 patients, including 34 rheumatic irAE patients (all with inflammatory arthritis), 26 ICI control patients (cancer patients receiving anti-PD-1/PD-L1 treatment without developing irAE), 47 RA control (age, sex and serologically matching rheumatic irAE patients) and 56 healthy controls. Flow cytometry was employed to analyze immune cell subsets, metabolic states, and response to soluble factors. Single cell RNA sequencing was performed on a small group of patients to profile gene expression. Beads based multiplex assay was carried out to measure plasma concentrations of major cytokines and chemokines. Autoantigen array was used to assess plasma autoantibody levels. T and B cells were purified and cultured in vitro to assess their functions in the presence of various cytokines and blocking antibodies.
Results: CD8+ T cells from irAE and ICI control patients exhibited elevated expression of effector molecules, but irAE CD8+ T cells, but not ICI control CD8+ T cells, had the highest level of cytotoxic molecule expression. RA control patients, but not irAE patients, had increased CD4/CD8 ratio and reduced regulatory T cell (Treg) frequency. IrAE CD4+ T cells had significantly increased CXCR3–CCR6– subset and reduced CXCR3+CCR6+subset compared to other control groups. Both CD4+ and CD8+ T cells from irAE patients exhibited increased metabolic activities. RA control patients, but not irAE patients, had increased frequency of CD11c+CD21–atypical B cells and increased level of autoantibodies. IrAE patients showed increased plasma levels of IL-6, IL-12 and enhanced expression of type I interferon (IFN) signatures. Combination of IL-6, IL-12 and IFNα promotes T cell cytotoxic gene expression, whereas blockade of IL-6 receptor, IL-12 and IFNA receptor reduces cytotoxic and metabolic phenotypes of irAE T cells.
Conclusion: Inflammatory arthritis irAE is immunologically distinct from conventional RA, distinguished by high level of cytotoxic gene expression in CD8+ T cells, reduced CXCR3 and CCR6 expression in CD4+ T cells and increased metabolic activity in both CD4+ and CD8+ T cells. It is likely driven primarily by autoreactive T cells following anti-PD-1/PD-L1 inhibition, but potentially independent of autoantibodies. Some of the immunological abnormalities may be driven by increased IL-6, IL-12 and type I IFN.
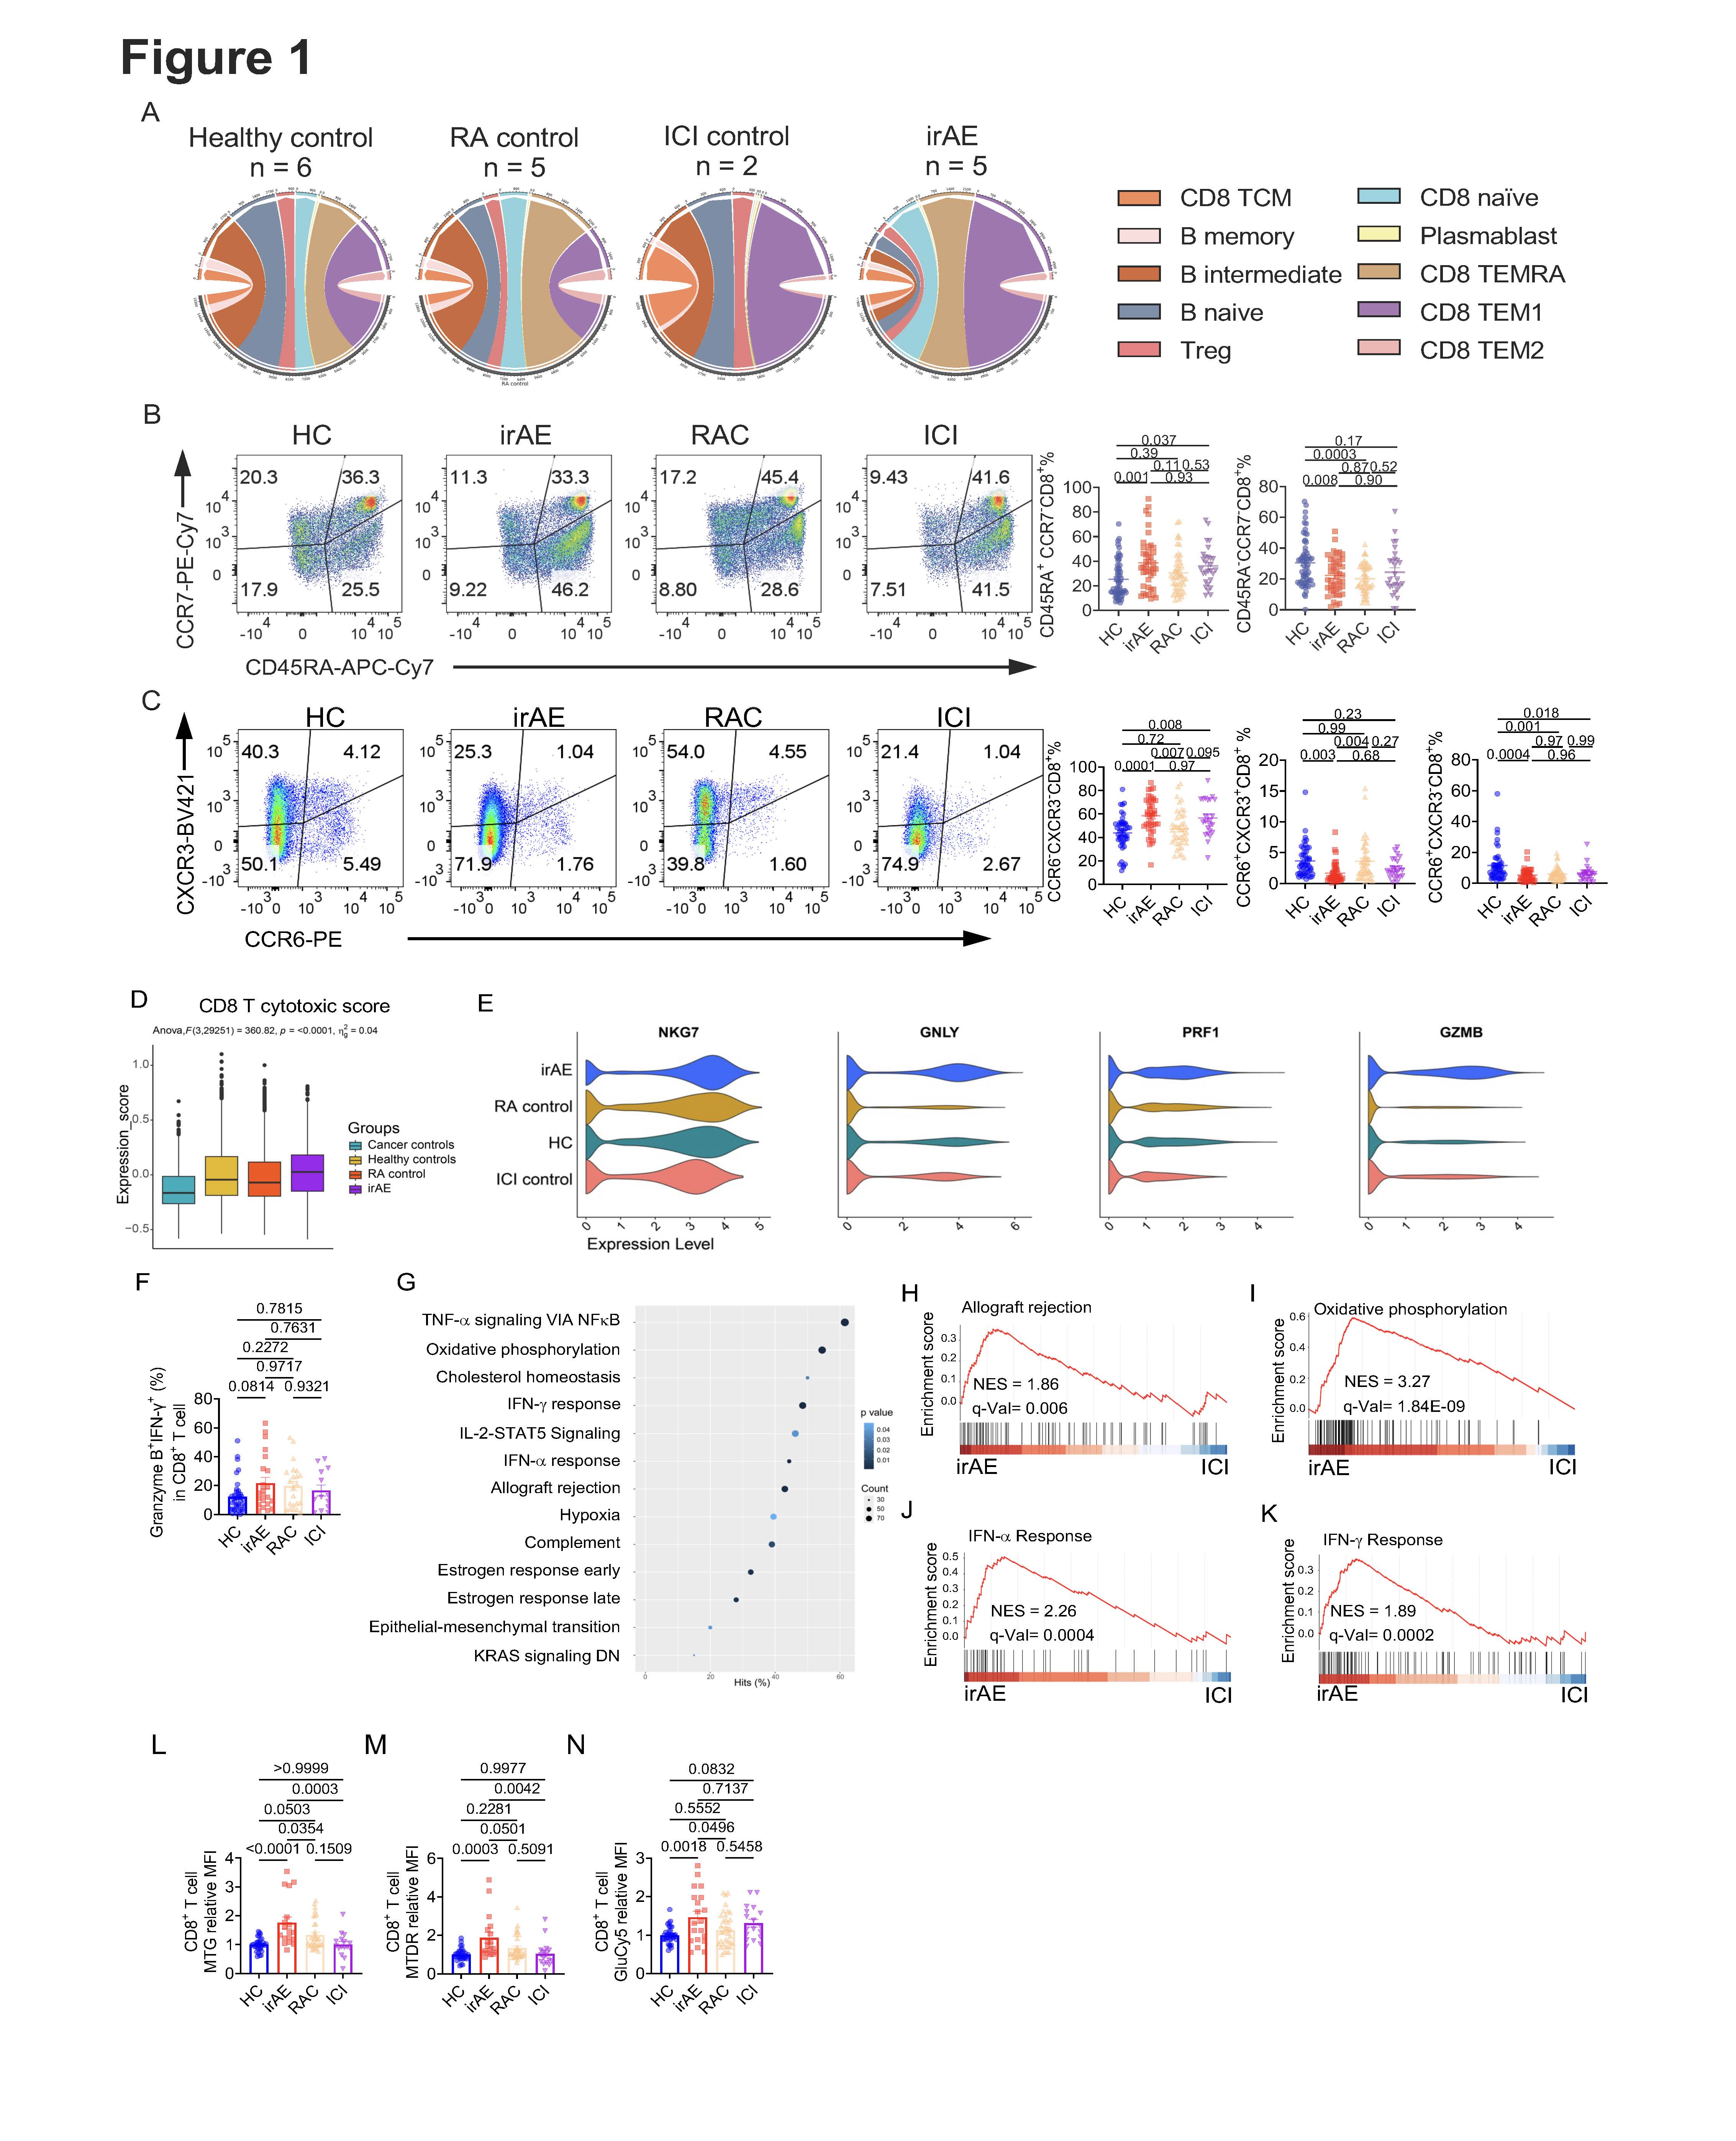 (A) Circos plots show the percentage of different subsets of CD8+ T cells and B cells. (B) Representative flow cytometry plot of CD45RA and CCR7 expression on CD8+ T cells from HC, ICI, RAC or irAE. Right, summaries of the percentage of CD45RA+CCR7–CD8+ T cells and CD45RA–CCR7–CD8+ T cells. (C) Representative flow cytometry plot of CXCR3 and CCR6 expression on CD8+ T cells. Right, summaries of CXCR3–CCR6–CD8+, CXCR3+CCR6+CD8+, and CCR6+CXCR3–CD8+ T cells. (D) The cytotoxic score was evaluated on CD8+ T cells using the gene list identified in the paper (78). (E) Specific cytotoxic or effector function–related genes were evaluated on the CD8+ T cells. (F) Fresh PBMCs from different groups were stimulated with PMA/Ionomycin/Monensin for 5 h, Granzyme B+IFN–g+CD8+ T cells were evaluated. (G–K) GSEA was performed on the CD8+ T cells between irAE and ICI. (G) Pathways that were significantly enriched in the comparison. GESA plot of the allograft rejection (H), oxidative phosphorylation (I), IFN–a response (J), and IFN–g response (K). (L–N) PBMCs from different groups were stimulated with 10 µg/mL plate–coated anti–CD3 and anti–CD28 for 5 days, dyes including mitochondria green (MTG) (L), mitochondria deep red (MTDR) (M), or GlucoseCy5 (GluCy5) (N) were examined on CD8+ T cells, and the expression was normalized to the HC in each experiment. Data in graphs represent mean ± SEM, Significance was tested by one-way ANOVA.
.jpg) (A) The ratio of CD4 to CD8 in the PBMCs was calculated. (B) Representative flow cytometry plot of CD25 and CD127 expression on CD4+ T cells. Right, a summary of the percentage of CD25+CD127lo regulatory T cells in CD4+ T cells from different groups. (C) Representative flow cytometry plot of CXCR5 and CD4 expression on the CD45RA–CD4+ T cells. Right, a summary of the percentage of CXCR5+CD45RA–CD4+ T cells. (D) Representative flow cytometry plot of CCR6 and CXCR3 expression on CD45RA–CD4+ T cells. Right, summaries of the percentage of CXCR3+CCR6–CD45RA–, CXCR3+CCR6+CD45RA–, CXCR3–CCR6–CD45RA– CD4+ T cells. (E–G) GSEA was performed on the CD4+ T cells between irAE and ICI. (E) Significantly enriched pathways in CD4+ T cells from irAE and ICI. GSEA plots of IFN–a and IFN–g response (F), and oxidative phosphorylation (G). (H–M) PBMCs from different groups were stimulated with 10 µg/mL plate–coated anti–CD3 and anti–CD28 for 5 days, dyes including MTDR (H), TMRM (I), or GluCy5 (J) were measured on CD4+ T cells, and the expression was normalized to the HC in each experiment. (K-M) Fresh PBMCs from different groups were stimulated with PMA/Ionomycin/Monensin for 5 h, and perforin+ (K), TNF–a+ (L) and IL–2+ CD4+ T cells were examined. Data in graphs represent mean ± SEM, Significance was tested by one-way ANOVA.
(A) The ratio of CD4 to CD8 in the PBMCs was calculated. (B) Representative flow cytometry plot of CD25 and CD127 expression on CD4+ T cells. Right, a summary of the percentage of CD25+CD127lo regulatory T cells in CD4+ T cells from different groups. (C) Representative flow cytometry plot of CXCR5 and CD4 expression on the CD45RA–CD4+ T cells. Right, a summary of the percentage of CXCR5+CD45RA–CD4+ T cells. (D) Representative flow cytometry plot of CCR6 and CXCR3 expression on CD45RA–CD4+ T cells. Right, summaries of the percentage of CXCR3+CCR6–CD45RA–, CXCR3+CCR6+CD45RA–, CXCR3–CCR6–CD45RA– CD4+ T cells. (E–G) GSEA was performed on the CD4+ T cells between irAE and ICI. (E) Significantly enriched pathways in CD4+ T cells from irAE and ICI. GSEA plots of IFN–a and IFN–g response (F), and oxidative phosphorylation (G). (H–M) PBMCs from different groups were stimulated with 10 µg/mL plate–coated anti–CD3 and anti–CD28 for 5 days, dyes including MTDR (H), TMRM (I), or GluCy5 (J) were measured on CD4+ T cells, and the expression was normalized to the HC in each experiment. (K-M) Fresh PBMCs from different groups were stimulated with PMA/Ionomycin/Monensin for 5 h, and perforin+ (K), TNF–a+ (L) and IL–2+ CD4+ T cells were examined. Data in graphs represent mean ± SEM, Significance was tested by one-way ANOVA.
.jpg) (A) Representative flow cytometry plot of CD27 and CD38 expression on the PBMCs. Right, summaries of the percentage of CD27hiCD38hi antibody–secreting cells (ASCs) and CD27+CD38– memory B cells. (B) Representative flow cytometry plot of CD138 in CD27hiCD38hi ASCs. Right, summaries of the percentage of CD138+ ASCs and CD138– ASCs. (C) Representative flow cytometry plot of CD11c and CD21 expression on IgD–CD27– B cells and summary of the percentage of CD11c+CD21–IgD–CD27– B cells. (D–F) GSEA was performed on the B cells between irAE and ICI. (D) Significantly enriched pathways in B cells from irAE and ICI. GSEA plots of IFN–a and IFN–g response (E), and Oxidative phosphorylation (F). (G) The volcano plot of the citrullinated or non–citrullinated relative IgG or IgM–isotype autoantigen levels comparing RA and HC, irAE and ICI, irAE and HC, or irAE and RA. The autoantigens were labeled when p < 0.01. Data in graphs represent mean ± SEM, Significance was tested by one-way ANOVA.
(A) Representative flow cytometry plot of CD27 and CD38 expression on the PBMCs. Right, summaries of the percentage of CD27hiCD38hi antibody–secreting cells (ASCs) and CD27+CD38– memory B cells. (B) Representative flow cytometry plot of CD138 in CD27hiCD38hi ASCs. Right, summaries of the percentage of CD138+ ASCs and CD138– ASCs. (C) Representative flow cytometry plot of CD11c and CD21 expression on IgD–CD27– B cells and summary of the percentage of CD11c+CD21–IgD–CD27– B cells. (D–F) GSEA was performed on the B cells between irAE and ICI. (D) Significantly enriched pathways in B cells from irAE and ICI. GSEA plots of IFN–a and IFN–g response (E), and Oxidative phosphorylation (F). (G) The volcano plot of the citrullinated or non–citrullinated relative IgG or IgM–isotype autoantigen levels comparing RA and HC, irAE and ICI, irAE and HC, or irAE and RA. The autoantigens were labeled when p < 0.01. Data in graphs represent mean ± SEM, Significance was tested by one-way ANOVA.
To cite this abstract in AMA style:
Zhu X, Yu y, Li Y, wang P, li y, McCabe C, chen s, Sharp B, Wolzen A, Langenfeld H, Hanson A, Crowson C, Markovic s, Davis J, Dong H, Thanarajasingam U, Zeng H. Inflammatory arthritis immune related adverse events represent a unique autoimmune disease entity primarily driven by T cells, but likely not autoantibodies [abstract]. Arthritis Rheumatol. 2025; 77 (suppl 9). https://acrabstracts.org/abstract/inflammatory-arthritis-immune-related-adverse-events-represent-a-unique-autoimmune-disease-entity-primarily-driven-by-t-cells-but-likely-not-autoantibodies/. Accessed .« Back to ACR Convergence 2025
ACR Meeting Abstracts - https://acrabstracts.org/abstract/inflammatory-arthritis-immune-related-adverse-events-represent-a-unique-autoimmune-disease-entity-primarily-driven-by-t-cells-but-likely-not-autoantibodies/