Session Information
Date: Monday, October 27, 2025
Title: Abstracts: B Cell Biology & Targets in Autoimmune & Inflammatory Disease (1691–1697)
Session Type: Abstract Session
Session Time: 3:15PM-3:30PM
Background/Purpose: Anti-neutrophil cytoplasmic autoantibody (ANCA)-associated vasculitis (AAV) is a severe autoimmune disease, characterized by ANCAs targeting myeloperoxidase (MPO) or proteinase-3 (PR3). ANCA-specific B cells have a central role in AAV pathophysiology, but current knowledge of their markers and pathways is limited. Rituximab is an effective treatment, but relapses remain challenging. Therefore, there is an unmet need for treatments that achieve durable remission. Aim of this study is to characterize ANCA-specific B cells in AAV patients to gain pathophysiologic insight and identify novel treatment targets.
Methods: B cell receptor repertoires and whole transcriptomes of B cells were analyzed with single cell RNA sequencing combined with CITE-seq in 15 AAV patients and 5 healthy controls (HCs) (Fig 1A). 184 monoclonal antibodies (mAbs) and 25 germlines were expressed of highly expanded and/or mutated B cells. Their target antigens were screened with ELISAs and affinity (Kd) was measured with bio-layer interferometry (Fig 2A). Neutrophils of HCs were isolated, fixed with ethanol and stained with mAbs to study ANCA staining patterns.
Results: Both anti-MPO+ and anti-PR3+ AAV patients had significantly increased proportion of plasmablasts (PBs) and decreased DN1 and DN2 B cells as compared to HCs (Fig 1B-D). Additionally, PBs exhibited large clonal expansions in AAV (Fig 1E), which were mostly IgA and IgG isotypes (Fig 1F). Somatic hypermutation (SHM) was significantly higher in IgA1+ and IgA2+ and lower in IgD+ and IgM+ B cells in AAV (Fig 1G-H). AAV patients had increased light chain rearrangements per clonal family (Fig 1I). Overall, the lambda usage was significantly higher and increased with larger clonal families (data not shown). Differential gene expression analysis of expanded B cell clones identified several significant up- and downregulated genes in AAV as compared to HC, including TNFRSF17, SDC1 and JCHAIN (Fig 1H-I), involved in B cell activation, survival, migration and antibody production. We identified 28 mAbs targeting MPO (7 anti-MPO+ and 2 anti-PR3+ patients) and 9 targeting PR3 (3 anti-PR3+ patients)(Fig 2B). The majority of MPO-specific B cells were IgA+/IgG+ PB or switched memory B cells (Fig 2C-D), clonally expanded and had increased SHMs (Fig 2E-F). PR3-specific B cells were clonally expanded IgG1-2-4 switched memory B cells (Fig 2G-J). Bio-layer interferometry demonstrated that the affinity (Kd) of several mAbs was 10-7–10-8 nM for the ANCA antigens (Fig 3A-F). Neutrophil stainings confirmed c-ANCA and p-ANCA pattern for respectively PR3- and MPO-specific mAbs (Fig 3G-H).
Conclusion: Our single cell RNA-seq analysis of B cells in AAV patients reveals significant alterations in B cell populations and their functional characteristics. AAV patients exhibit increased clonal expansions, somatic hypermutation in IgA+ B cells and light chain rearrangements. Our findings suggest a potential ongoing mucosal immune activation in these AAV patients. Our characterization of ANCA-specific B cells and their dysregulated activation provides insight into the pathogenic mechanisms underlying AAV and underscores the potential for future therapeutic applications and biomarker development.
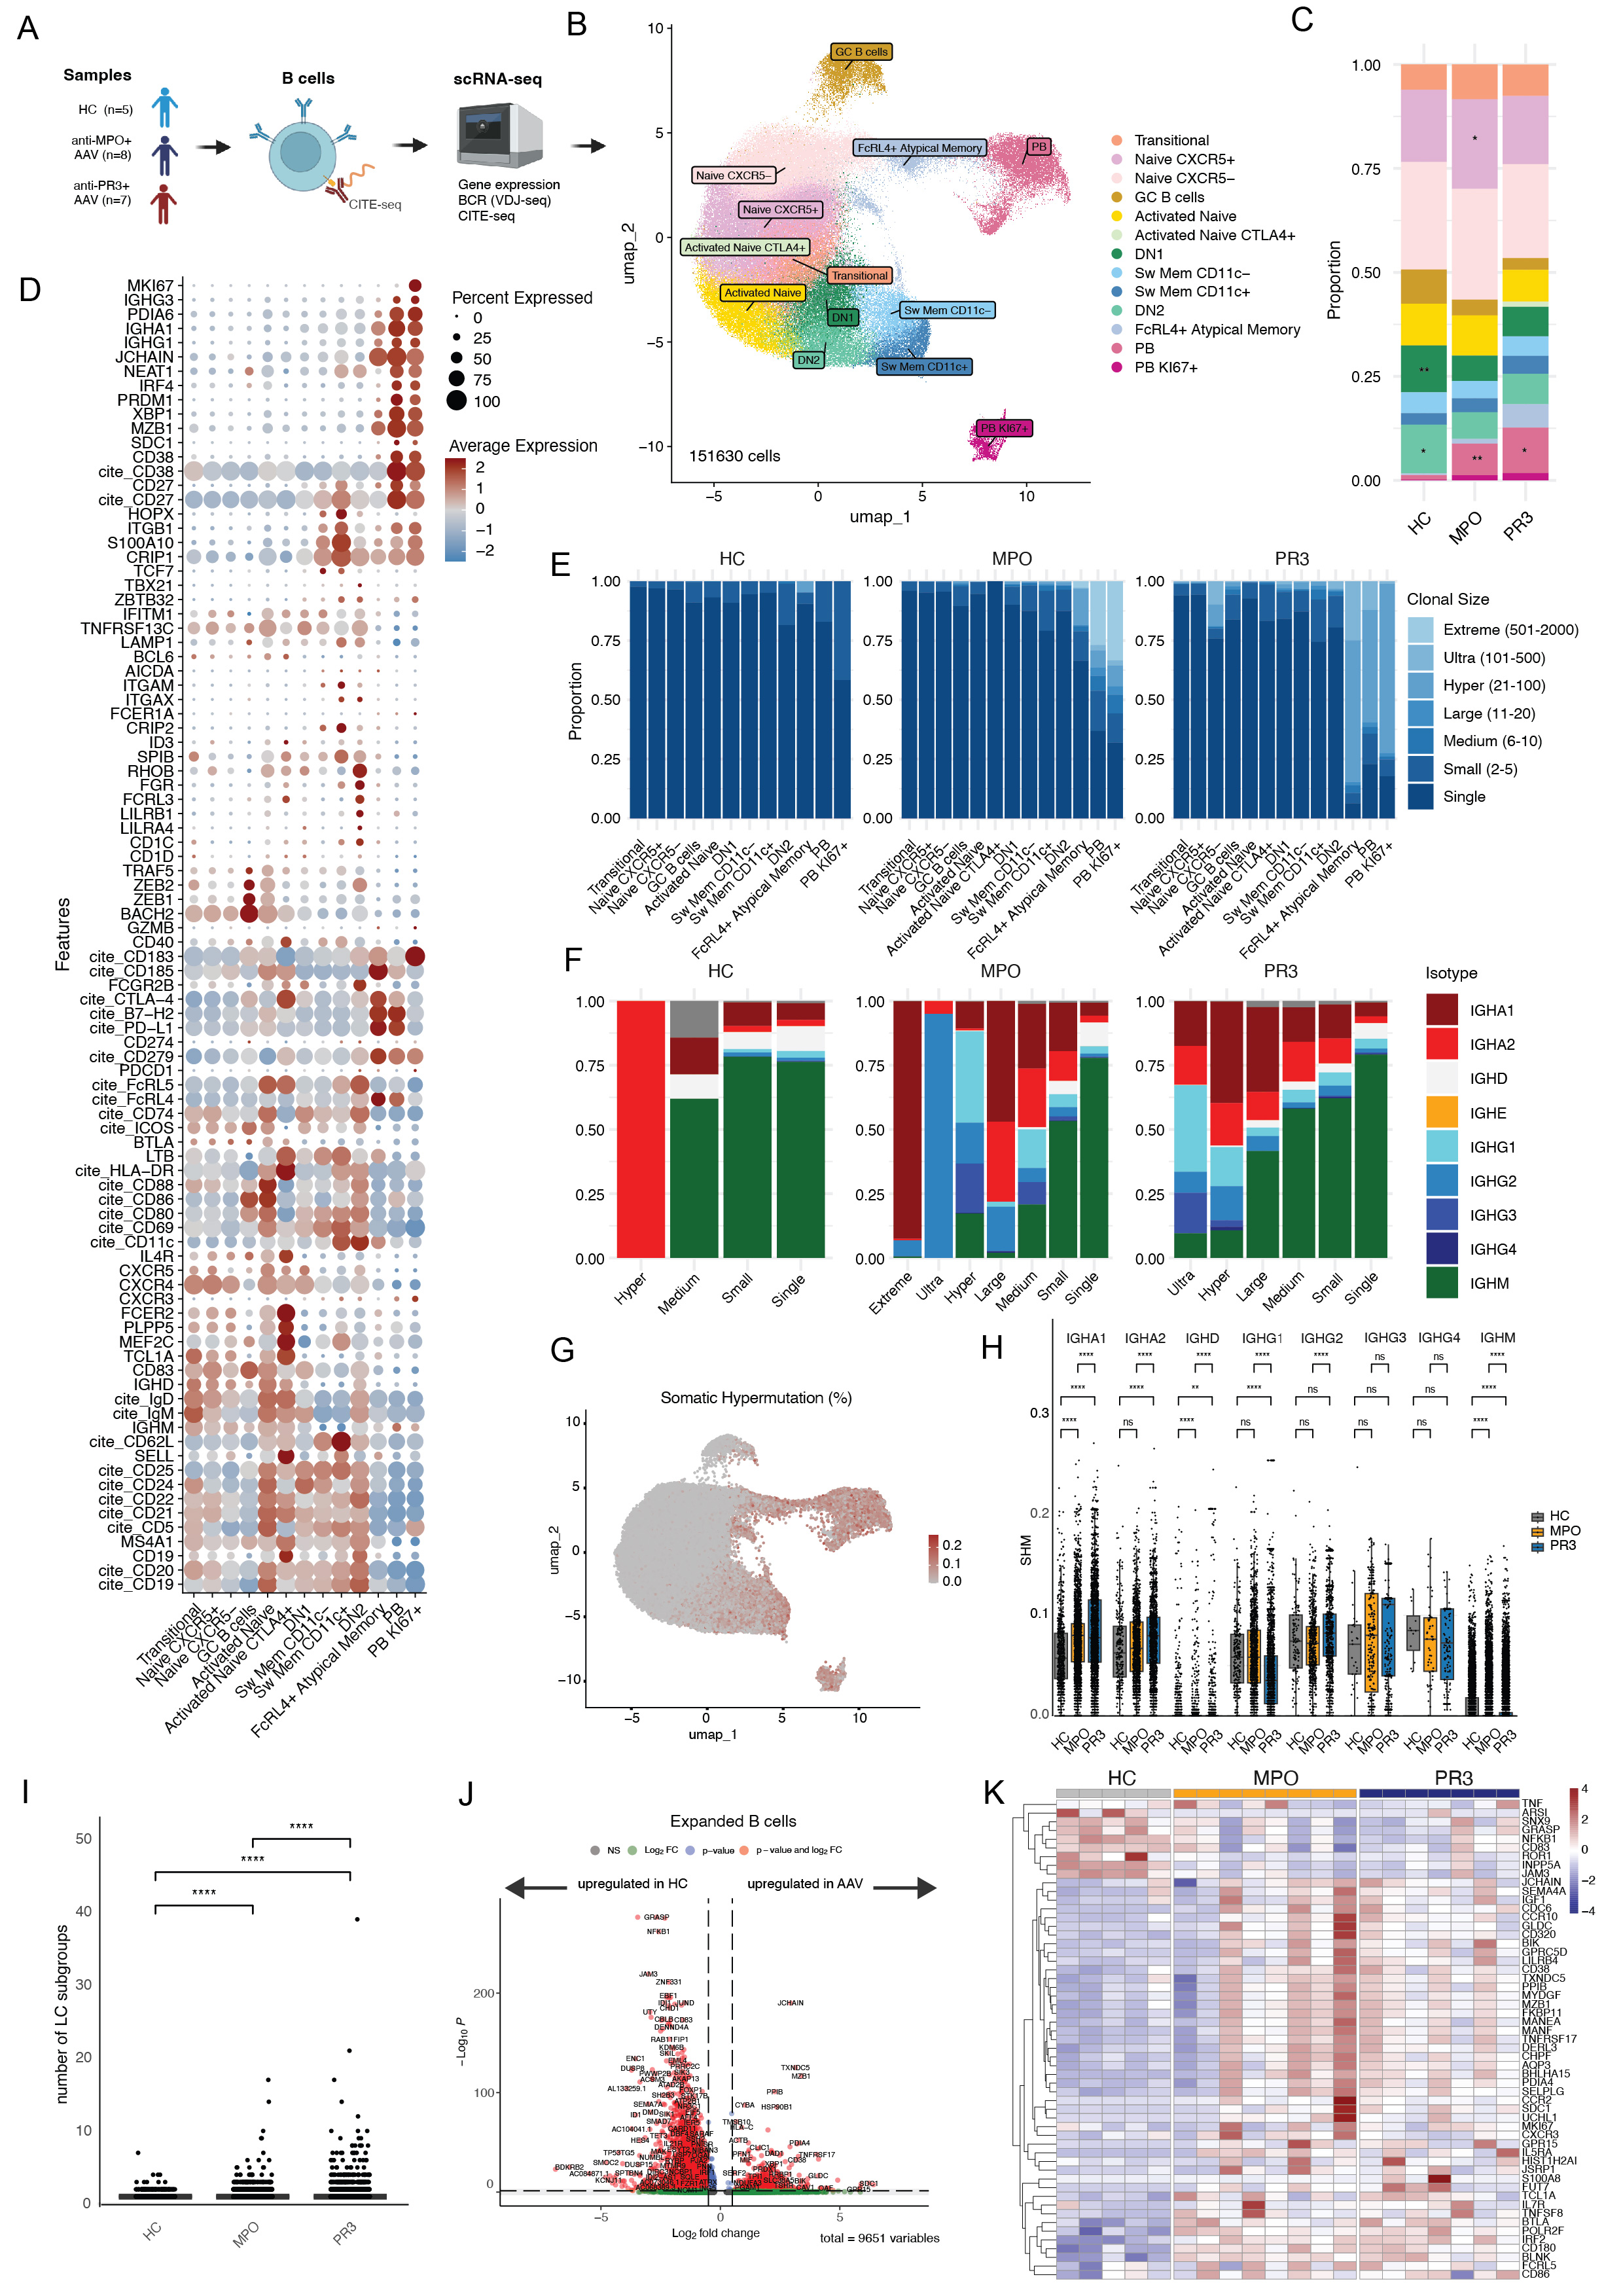 Figure 1. Overview of single cell RNA sequencing of B cells and B cell receptor (BCR) repertoires in ANCA-associated vasculitis patients (n=15) and healthy controls (n=5). A) Whole transcriptome and BCRs of B cells from 8 anti-MPO and 7 anti-PR3 AAV and 5 HC were analyzed with single cell RNA sequencing combined with CITE-seq. B) Thirteen distinct B cell subsets were identified after unsupervised clustering and annotated based upon gene and CITE-seq expression, visualized in a UMAP plot (n=151630 cells). C) Proportions of different B cell clusters for HC, anti-MPO, anti-PR3 AAV patients. *p < 0.05, **p < 0.01. D) Dotplot of gene and CITE-seq expression of B cell markers which was used to annotate the different B cell clusters. E) Clonal family size of B cells in the different B cell clusters in HC, anti-MPO and anti-PR3 AAV patients. F) Isotypes within the different clonal family size groups for HC, anti-MPO and anti-PR3 AAV patients. G) Umap plot with somatic hypermutation frequency displayed. H) Somatic hypermutation per isotype in different patient subgroups. I) Number of light chain rearrangements within each clonal family based on heavy chain. J) Differential gene expression analysis of expanded B cells, comparing AAV versus HC. K) Heatmap of normalized pseudobulk expression of genes which are significantly differently expressed in expanded B cells comparing AAV versus HC.
.jpg) Figure 2. B cell receptor repertoire studies. A) Simplified methods overview of the expression of monoclonal antibodies. Sequences from highly expanded and/or mutated BCR repertoires were selected and expressed as monoclonal antibodies for downstream analyses. B) Heatmap of ELISA binding of monoclonal antibodies (n=184) and germline antibodies (n=25) from 12 AAV patients. mAbs were titrated (10, 3, 1, 0.33 ug/ml) on MPO, PR3 and mutated PR3 ELISAs. Mutated PR3 has a point mutation at S176A, resulting in lack of enzyme activity, and lack the N-terminal propeptide, resulting in mature PR3 (as published previously Specks et al. 2000 Arthritis Res.). C-F) Characteristics of MPO-specific B cells including C) Cell types, D) Isotypes, E) Clonal expansions, F) Somatic hypermutation. G-J) Characteristics of PR3-specific B cells incuding G) Cell types, H) Isotypes, I) Clonal expansions, J) Somatic hypermutation. ** p < 0.01, *** p < 0.001, **** P < 0.0001.
Figure 2. B cell receptor repertoire studies. A) Simplified methods overview of the expression of monoclonal antibodies. Sequences from highly expanded and/or mutated BCR repertoires were selected and expressed as monoclonal antibodies for downstream analyses. B) Heatmap of ELISA binding of monoclonal antibodies (n=184) and germline antibodies (n=25) from 12 AAV patients. mAbs were titrated (10, 3, 1, 0.33 ug/ml) on MPO, PR3 and mutated PR3 ELISAs. Mutated PR3 has a point mutation at S176A, resulting in lack of enzyme activity, and lack the N-terminal propeptide, resulting in mature PR3 (as published previously Specks et al. 2000 Arthritis Res.). C-F) Characteristics of MPO-specific B cells including C) Cell types, D) Isotypes, E) Clonal expansions, F) Somatic hypermutation. G-J) Characteristics of PR3-specific B cells incuding G) Cell types, H) Isotypes, I) Clonal expansions, J) Somatic hypermutation. ** p < 0.01, *** p < 0.001, **** P < 0.0001.
.jpg) Figure 3. The binding affinity (Kd) of several mAbs with MPO or PR3 was measured with bio-layer interferometry. A) 25nM mab19 binding affinity curves with different molarities of MPO. B) 25nM and 100nM mab98 binding affinity curves with different molarities of MPO. C) Binding affinity Kd values of several mAbs for MPO. D-E) Titration of mAb 8 binding affinity curves with different molarities of PR3. F) Binding Affinity Kd values of mab 8 for PR3. G-H) Neutrophils were isolated and fixed with ethanol on ibidi slides, afterwards stained with 1ug/ml mab8 (G) or 1ug/ml mab49 (H), secondary anti-human IgG-Alexa488, DAPI and visualized with fluorescence microscopy.
Figure 3. The binding affinity (Kd) of several mAbs with MPO or PR3 was measured with bio-layer interferometry. A) 25nM mab19 binding affinity curves with different molarities of MPO. B) 25nM and 100nM mab98 binding affinity curves with different molarities of MPO. C) Binding affinity Kd values of several mAbs for MPO. D-E) Titration of mAb 8 binding affinity curves with different molarities of PR3. F) Binding Affinity Kd values of mab 8 for PR3. G-H) Neutrophils were isolated and fixed with ethanol on ibidi slides, afterwards stained with 1ug/ml mab8 (G) or 1ug/ml mab49 (H), secondary anti-human IgG-Alexa488, DAPI and visualized with fluorescence microscopy.
To cite this abstract in AMA style:
van Dam L, Zhang M, Parsafar S, Horomanski A, Rasouli S, Sharpe O, van Leeuwen J, Lanz T, van Kooten C, Teng O, Robinson W. Characterizing ANCA-specific B Cells in ANCA-associated Vasculitis [abstract]. Arthritis Rheumatol. 2025; 77 (suppl 9). https://acrabstracts.org/abstract/characterizing-anca-specific-b-cells-in-anca-associated-vasculitis/. Accessed .« Back to ACR Convergence 2025
ACR Meeting Abstracts - https://acrabstracts.org/abstract/characterizing-anca-specific-b-cells-in-anca-associated-vasculitis/