Session Information
Date: Tuesday, October 28, 2025
Title: (2377–2436) Systemic Lupus Erythematosus – Diagnosis, Manifestations, & Outcomes Poster III
Session Type: Poster Session C
Session Time: 10:30AM-12:30PM
Background/Purpose: Autoreactive B cell populations play a key role in the pathogenesis of lupus nephritis (LN). Therefore, it is hypothesized that dysregulation in the B cell compartment may be an early indicator of kidney involvement in SLE. The AMP-AIM lupus nephritis study was initiated to identify molecular drivers of kidney disease in SLE patients with minimal proteinuria (considered “early” disease). Accordingly, this study leveraged CyTOF performed at the time of a kidney biopsy in AMP-AIM to characterize alterations within the B cell lineage between LN and non-LN cases and within LN disease classes.
Methods: Twenty-five patients fulfilling diagnostic criteria for SLE with a urine protein creatinine ratio between 0.25 – 0.49 without a history of LN but an additional risk factor for LN including active sediment and/or serologies were enrolled in AMP-AIM. Whole blood was collected at the time of their kidney biopsy and stained at the point of collection on the same day using the Maxpar Direct Immune Profiling Assay (MDIPA), a comprehensive panel of 30 markers to capture the broad immune phenotype of the samples. The samples were stabilized and shipped to a central location where data were captured using the CyTOF XT platform. Low-quality events were excluded with FlowCut and cells were gated to include only the B cell lineage. Dimension reduction and clustering were performed using ClusterX. All pairwise comparisons were made with the Wilcoxon rank-sum test.
Results: Table 1 shows the clinical characteristics of the patients with and without LN at biopsy. ClusterX captured a total of 15 clusters within B cells (Figure 1A & 1B). Two clusters, both CD11c positive, were elevated in LN vs non-LN cases (Figure 2). One was IgD positive (B12) and the other was IgD negative (B6) (p=0.023 and p=0.0024 respectively). A naïve B cell cluster characterized as CXCR3 positive and CXCR5 positive (B9) was also expanded in LN compared to non-LN cases (p=0.0048). Surprisingly, elevated frequencies for all three clusters were seen in class V compared to class III (B6, p=0.18; B9, p=0.052; B12, p=0.082) (Figure 2). An additional CXCR5 and CCR7 positive naïve B cell cluster (B5) was also significantly elevated in class V compared to class III (p=0.034). These differences were also reflected in hierarchical clustering of the samples (Figure 2B).
Conclusion: Whole blood profiling at the point of collection, which likely reduced artifactual findings compared to prior studies which have relied on PBMCs, yielded several differences between LN and non-LN cases at the time of biopsy. These data suggest B cell dysregulation may be detected “early” in kidney involvement in SLE patients, especially with class V histology. Whole blood profiling at the point of collection, which likely reduced artifactual findings compared to prior studies which have relied on PBMCs, yielded several differences between LN and non-LN cases at the time of biopsy. These data suggest B cell dysregulation may be detected “early” in kidney involvement in SLE patients, especially with class V histology.
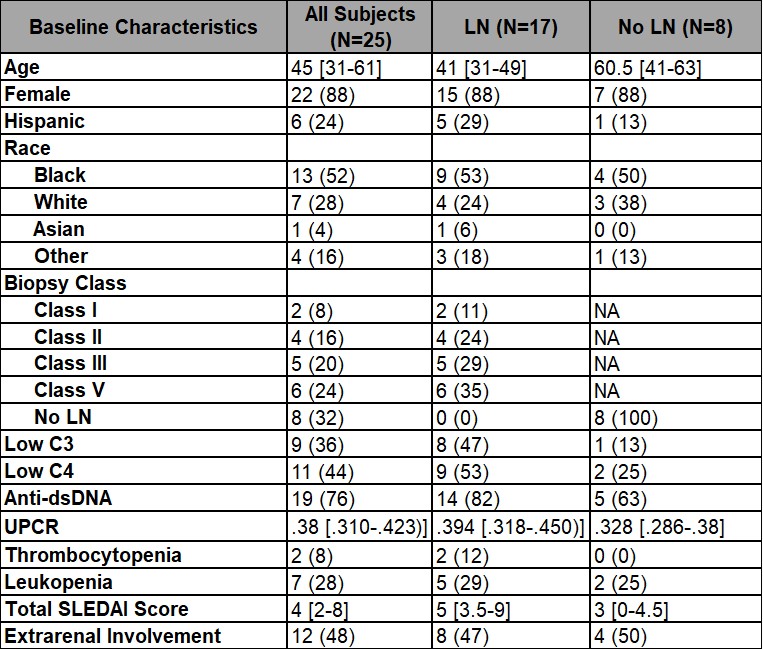 Table 1: Clinical characteristics of patients with and without LN. Data are represented as median [IQR], or n (%). *4 non LN but unknown other histology, 2 arteriosclerosis, 1 diabetic nephropathy, 1 microangiopathy.
.jpg) Figure 1. B cell clusters in LN and Non LN cases. (A): Uniform Manifold Approximation and Projection (UMAP) dimension reduction visualizing the different B cell clusters (top left) and the differences in their density (top right) (B): Marker expression in each of the B cell clusters (C): PCA based on B cell clusters colored by biopsy histology.
Figure 1. B cell clusters in LN and Non LN cases. (A): Uniform Manifold Approximation and Projection (UMAP) dimension reduction visualizing the different B cell clusters (top left) and the differences in their density (top right) (B): Marker expression in each of the B cell clusters (C): PCA based on B cell clusters colored by biopsy histology.
.jpg) Figure 2. Four B cell clusters differentiate LN and non LN (A): Boxplots showing the four B cell clusters significantly different between Non LN and LN cases. LN is further divided into mesangial, membranous, and proliferative histology. P-values for Non LN vs LN and membranous vs proliferative are reported (B): Heatmap showing the expression of each cluster in all cases.
Figure 2. Four B cell clusters differentiate LN and non LN (A): Boxplots showing the four B cell clusters significantly different between Non LN and LN cases. LN is further divided into mesangial, membranous, and proliferative histology. P-values for Non LN vs LN and membranous vs proliferative are reported (B): Heatmap showing the expression of each cluster in all cases.
To cite this abstract in AMA style:
Bauer N, Carlucci P, Lu R, Guthridge C, Stephens T, Jones B, DeJager W, Macwana S, Fava A, Sanyal S, Carter E, Masson M, Anolik J, Barnas J, Izmirly P, Belmont H, Ruggles K, ALE06 Clinical S, Rovin B, Buyon J, Petri M, James J, Guthridge J. Whole Blood Immune Phenotyping Reveals Cytometric Differences in B Cell Clusters Between Lupus Nephritis and Non-Lupus Nephritis SLE Patients with Minimal Proteinuria [abstract]. Arthritis Rheumatol. 2025; 77 (suppl 9). https://acrabstracts.org/abstract/whole-blood-immune-phenotyping-reveals-cytometric-differences-in-b-cell-clusters-between-lupus-nephritis-and-non-lupus-nephritis-sle-patients-with-minimal-proteinuria/. Accessed .« Back to ACR Convergence 2025
ACR Meeting Abstracts - https://acrabstracts.org/abstract/whole-blood-immune-phenotyping-reveals-cytometric-differences-in-b-cell-clusters-between-lupus-nephritis-and-non-lupus-nephritis-sle-patients-with-minimal-proteinuria/