Session Information
Date: Monday, November 8, 2021
Title: Epidemiology & Public Health Poster III: Other Rheumatic & Musculoskeletal Diseases (1022–1060)
Session Type: Poster Session C
Session Time: 8:30AM-10:30AM
Background/Purpose: The FDA accepts medial minimum joint space width (mJSW) in the tibiofemoral (TF) compartment as the standard for structural change in clinical trials of potential disease modifying OA drugs (DMOADs) for knee osteoarthritis (OA). Historical and novel imaging biomarkers of knee OA should be investigated in terms of their ability to predict clinically important outcomes. Quantitative radiographic OA scores (QROS), software developed to read fixed-flexion knee radiographs based on an anatomical coordinate system, generates medial mJSW and other quantitative measures. Our objective was to compare the clinical relevance of QROS-generated radiographic measurements based on their contributions to predicting time to knee replacement, and to assess a novel measure of structure, variance of JSW across the TF joint.
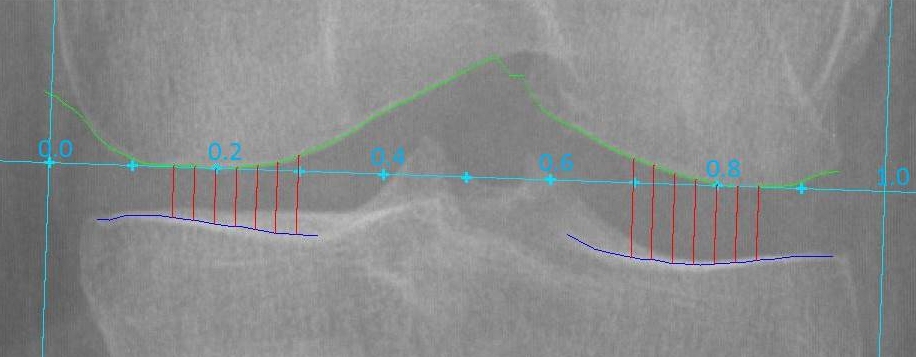
Methods: We selected knees with a baseline radiograph graded Kellgren-Lawrence (KL) 2 or 3 and QROS assessment at baseline and year 2, from the Osteoarthritis Initiative, a longitudinal observational study. QROS was used to measure medial mJSW and corresponding location, JSW measured at fixed locations across the joint (Figure 1), femoral tibial angle, width of the femoral condyles, distance from the tibial plateau to the tibial rim closest to the femoral condyle as a measure of knee positioning, and x-ray beam angle. We calculated the variance of fixed JSW measurements across the joint. Participants reported knee replacements up to 10 years following the year 2 clinic visit, confirmed by medical records and/or radiographs.
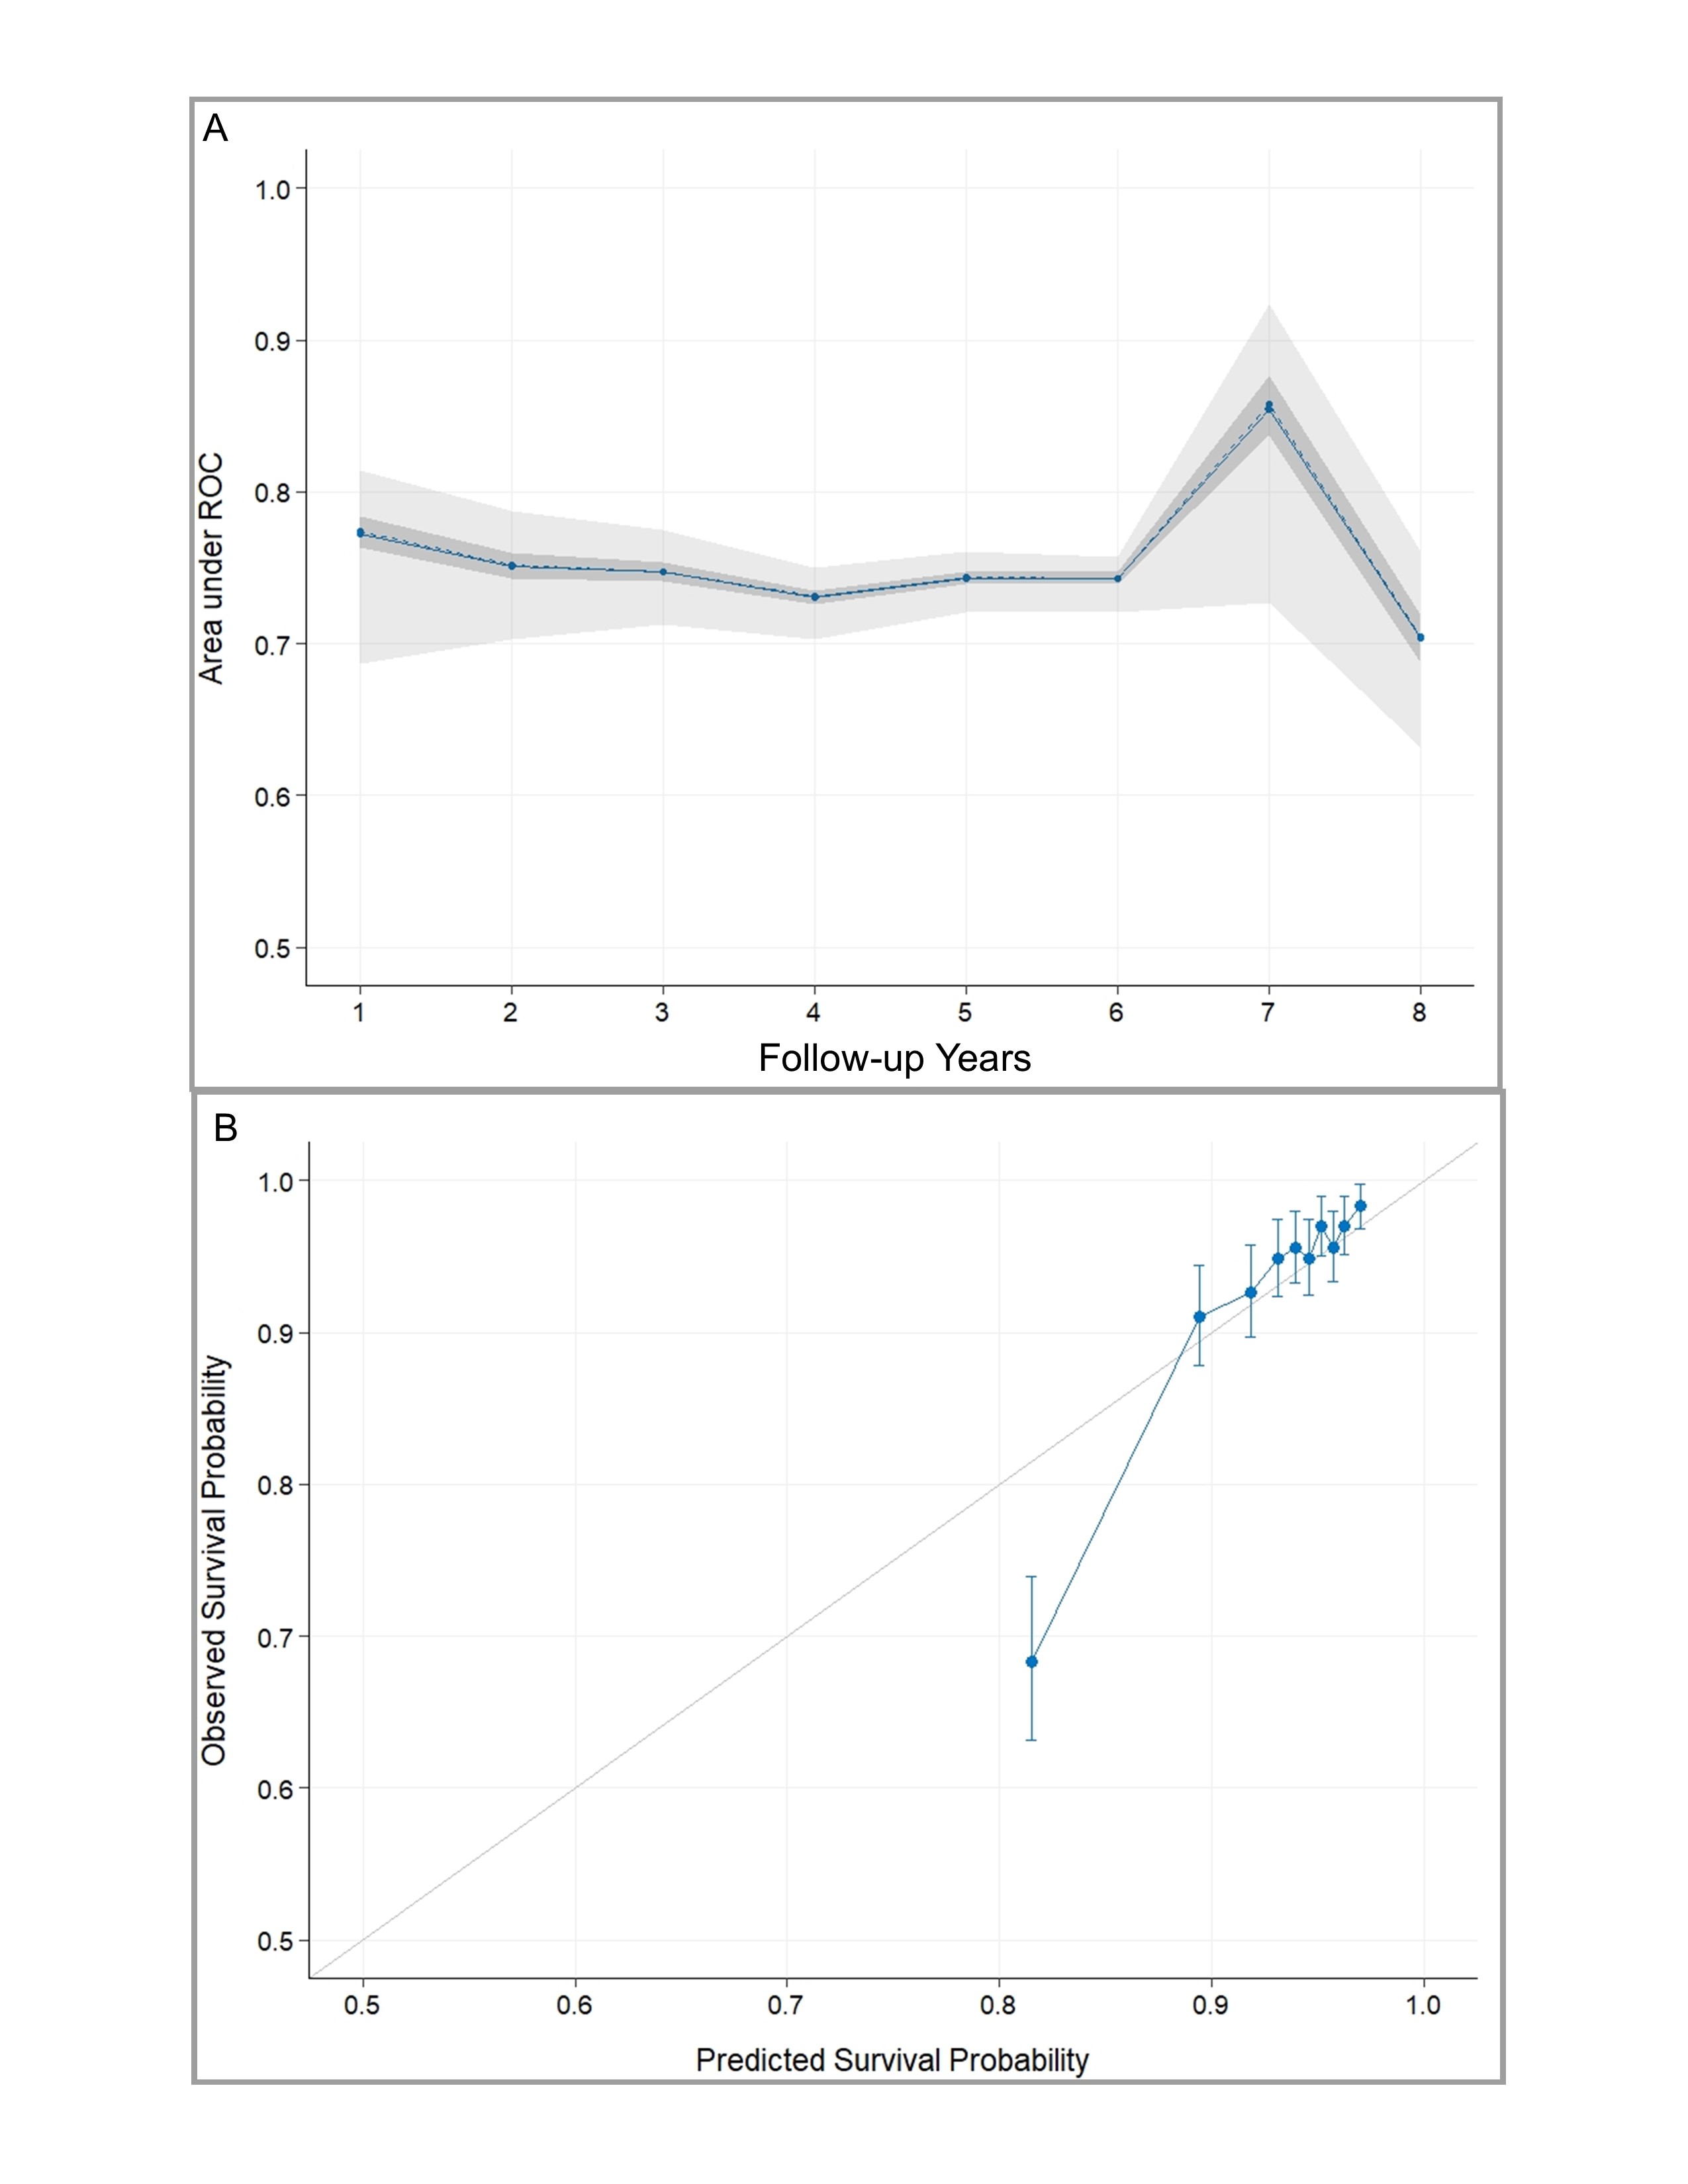
We fit lasso penalized Cox models, including baseline measurements and change over 2 years, selecting the penalty parameter that achieved a partial log-likelihood deviance within one standard error of the minimum in 10-fold cross validation. Technical problems prevented some measurements in up to 9% of knees; we used multivariate imputation by chained equations to account for uncertainty in missing values. Model discrimination was evaluated with a bootstrap estimate of the time-dependent area under the receiver operating characteristic curve (AUC), and model calibration was visually inspected by plotting predicted versus observed survival probabilities.
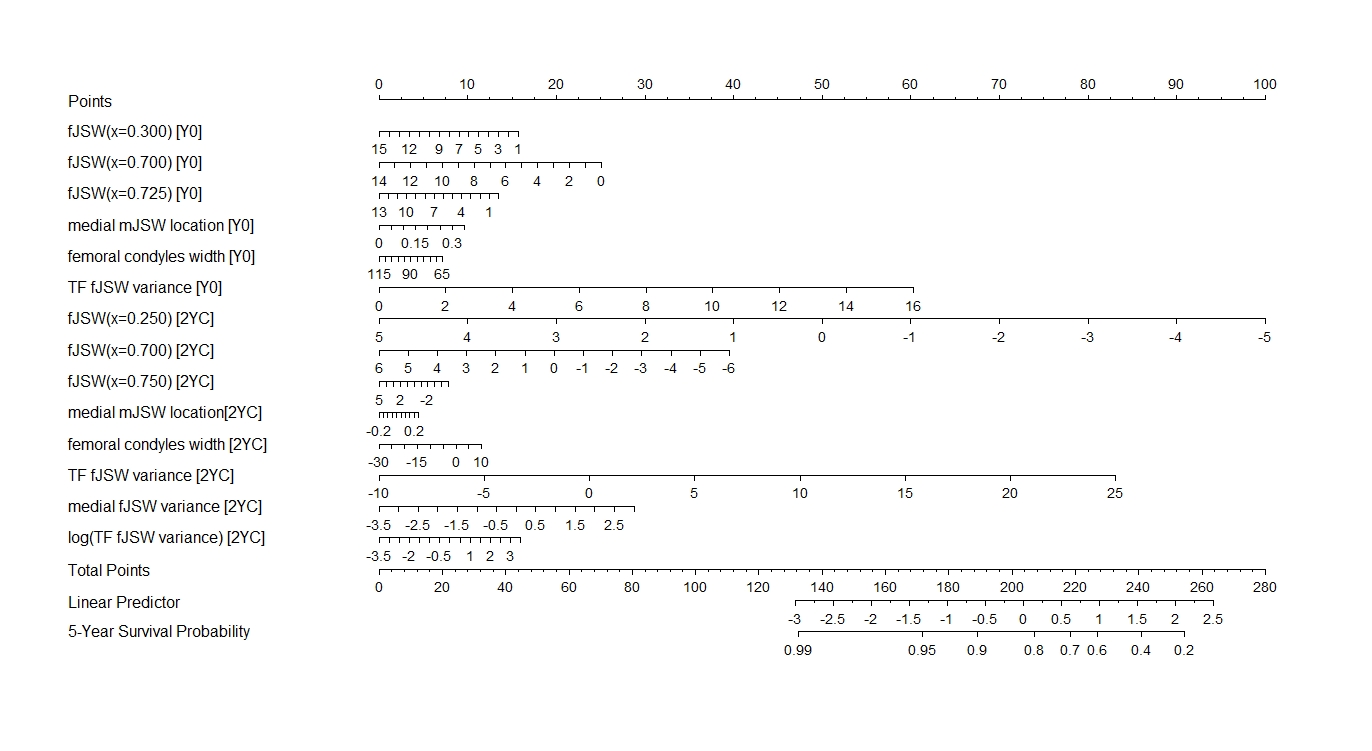
Results: The sample included 3,082 KL 2,3 knees with 327 knee replacement outcomes over a median of 6.9 years, contributed by 2,101 participants. Lasso-selected predictors of time to knee replacement are shown in Figure 2. Important predictors included baseline and 2-year change of fJSW at specific locations in the TF joint, baseline and 2-year change of TF fJSW variance, baseline and 2-year change of medial mJSW location as well as 8 other variables. Model performance, as summarized by model discrimination and model calibration, is shown in Figure 3.
Conclusion: We developed an innovative measure of knee OA structure and progression, TF fJSW variance, which may reflect degree of bone curvature, asymmetry of cartilage thickness, and/or uneven joint loading. Baseline and 2-year change of TF fJSW variance, as well as other quantitative measures from QROS, were identified as important predictors of time to knee replacement. Further work needs to be done to validate TF fJSW variance as a potential imaging biomarker of knee OA progression.
 Figure 1. Fixed-location joint space width (JSW) measurements provided by quantitative radiographic OA scores (QROS) software. The variance of fixed-location JSW across the tibiofemoral joint (TF) may reflect degree of bone curvature, asymmetry of cartilage thickness in the TF joint, and/or uneven joint loading.
 Kwoh Figure 2 nomogram.jpeg”Figure 2. QROS predictors of 5-year survival. Nomogram visualization of exploratory analysis shows model-based points for lasso-selected predictors and mapping between total points and 5-year probability of survival from knee replacement. Y0 indicates OAI year 0 (baseline), and 2YC indicates 2-year change (from baseline to year 2).
 Figure 3. Model Performance. A) Discrimination: Time-dependent area under the receiver operating characteristic curve (AUC), estimated with a bootstrap. The darker interval in the plot shows the 25% and 75% quantiles and the lighter interval shows the minimum and maximum AUC from the bootstrap samples. B) Calibration: Predicted vs observed knee replacement survival at 5 years of follow-up, in 10 model-based risk groups. Bars represent 95%CI for survival probability estimated by Kaplan-Meier method.
To cite this abstract in AMA style:
Kwoh K, Ashbeck E, Bedrick E, Sun X, Duryea J. Variance of Joint Space Width Across the Tibiofemoral Joint on Knee Radiographs: A Novel Measure of Structure and Progression [abstract]. Arthritis Rheumatol. 2021; 73 (suppl 9). https://acrabstracts.org/abstract/variance-of-joint-space-width-across-the-tibiofemoral-joint-on-knee-radiographs-a-novel-measure-of-structure-and-progression/. Accessed .« Back to ACR Convergence 2021
ACR Meeting Abstracts - https://acrabstracts.org/abstract/variance-of-joint-space-width-across-the-tibiofemoral-joint-on-knee-radiographs-a-novel-measure-of-structure-and-progression/
