Session Information
Session Type: Poster Session A
Session Time: 1:00PM-3:00PM
Background/Purpose: To analyze recent trends in the rheumatology workforce related to temporal and national geographic variation in the United States (US).
Methods: The publicly available physician workforce database was accessed via the Association of American Medical Colleges (AAMC) website for the years 2015, 2017, 2019, and 2021. The variables collected for each state included a total number of active physicians, female physicians, and physicians with age > 60 years old. Census data, specifically for MD and DO physicians were collected via the Federation of State Medical Boards (FSMB) census of licensed physicians report. The annual growth rate for total physicians, and sub-analysis of MD, DO, female physicians, and physicians above the age of 60 years was computed for each state. Geographic variation and annual trends were analyzed.
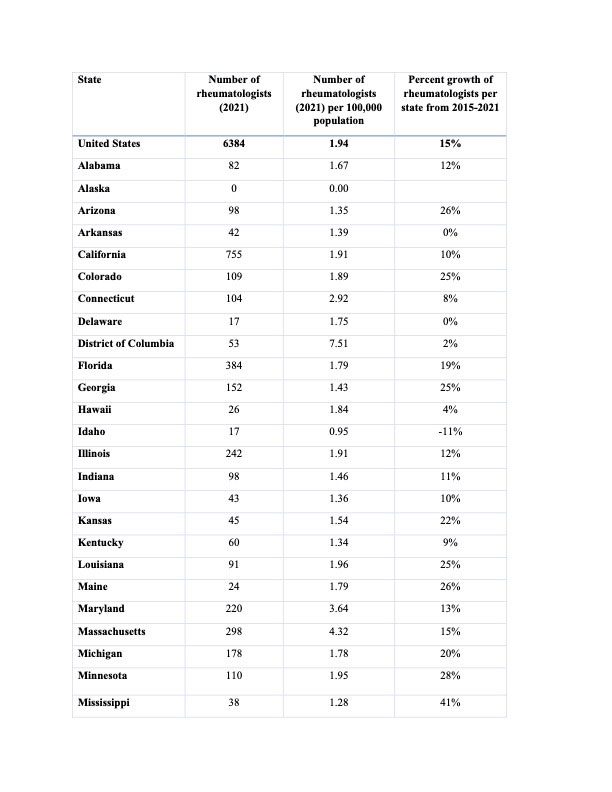
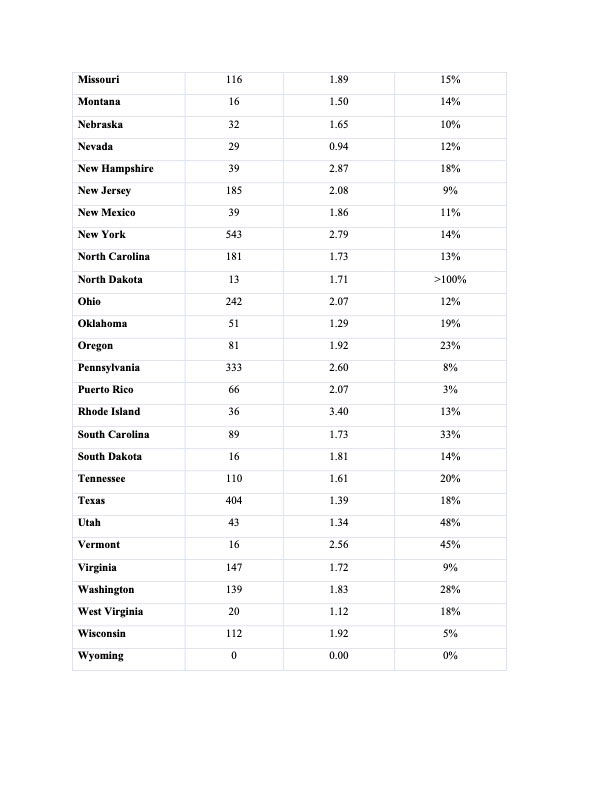
Results: From 2015 to 2021, nationally, the total number of active physicians in the US grew by 9.8%. The highest growth was seen in the District of Columbia whereas the state with the lowest growth was Idaho. Rheumatologists per 100K population, increased from 1.74 to 1.94, showing a growth of 15%. State-to-state variation was huge and ranged from -11% to >100%. The state with the highest positive change was North Dakota where rheumatologists increased from 0 to 13 during that time period. Utah had an increase of 48% (29 to 43) followed by Vermont with an increase of 45% (11 to 16). In contrast, Arkansas, Delaware, and Wyoming showed a 0% change. Interestingly, Idaho showed an 11% (19 to 17) decrease over the years. Per 100K population, the rate of rheumatology MD physicians decreased by 16.7%, whereas, the rate of DO physicians increased by 4.2%.
The total number of active physicians above the age of 60 years has increased over the years. In 2015, 1800 of all rheumatologists were above the age of 60 years which increased to 2235 in 2021, this was a growth rate of 3%. But when compared to the entire physician workforce, the total number of rheumatology physicians above the age of 60 years has overall decreased by 0.02%. The state with the highest increase in rheumatologists above the age of 60 years is Illinois and the highest decrease is Indiana.
The total number of female physicians grew from 32.1% in 2015 to 50% in 2021. In the year 2021, 50.4% of the rheumatologist workforce comprised of females. This was an increase in the number of female rheumatologists by 9.5% (from 40.9% in 2015). Female rheumatologists increased at a rate of 1.6% annually. In 2021, the state of Oklahoma has the highest proportion of female rheumatologists at 52.9%.
Conclusion: The number of rheumatologists is increasing and when compared to the national growth, it is a significantly fast increment. State to state variations in the workforce is very high ranging from negative to exponential growth, which may depend on several factors such as availability of a job or visa, and personal preference.
Despite an increase in female physicians in the national physician workforce, the number of female rheumatologists has not increased at the same rate as the number of females in the overall workforce. Physicians above the age of 60 years have been increasing in the rheumatology workforce, but slightly decreased when compared to the overall workforce.
To cite this abstract in AMA style:
Singh K, Foster-Johnson L, Skopelja-Gardner S, Rasendrakumar A, Ajayi T, Khanna A. The Rheumatology Workforce: Analyzing Geographic and Temporal Variations Among the Rheumatology Physician Workforce in the United States [abstract]. Arthritis Rheumatol. 2022; 74 (suppl 9). https://acrabstracts.org/abstract/the-rheumatology-workforce-analyzing-geographic-and-temporal-variations-among-the-rheumatology-physician-workforce-in-the-united-states/. Accessed .« Back to ACR Convergence 2022
ACR Meeting Abstracts - https://acrabstracts.org/abstract/the-rheumatology-workforce-analyzing-geographic-and-temporal-variations-among-the-rheumatology-physician-workforce-in-the-united-states/


