Session Information
Session Type: Abstract Session
Session Time: 2:30PM-2:45PM
Background/Purpose: Patients who enroll in interventions are likely to do so when they experience a flare-up in symptoms. This may create issues in interpretation of effectiveness due to regression to the mean (RTM). We evaluated signs of RTM in patients from a first-line intervention for knee osteoarthritis (OA).
Methods: We used data from the Good Life with osteoArthritis in Denmark (GLA:D®) program of knee OA patients enrolled from July, 2018 until January, 2019 and included data on knee pain measured with KOOS-12 pain subscale (0-100, worst to best) at baseline, 3 and 12 months. GLA:D® is an 8-week exercise and education program for OA. Radiographic OA is not required, but 86% of the knee OA patients reported that they had knee X-rays taken prior to commencing the program, and more than 90% of those stated that the images showed signs of OA.
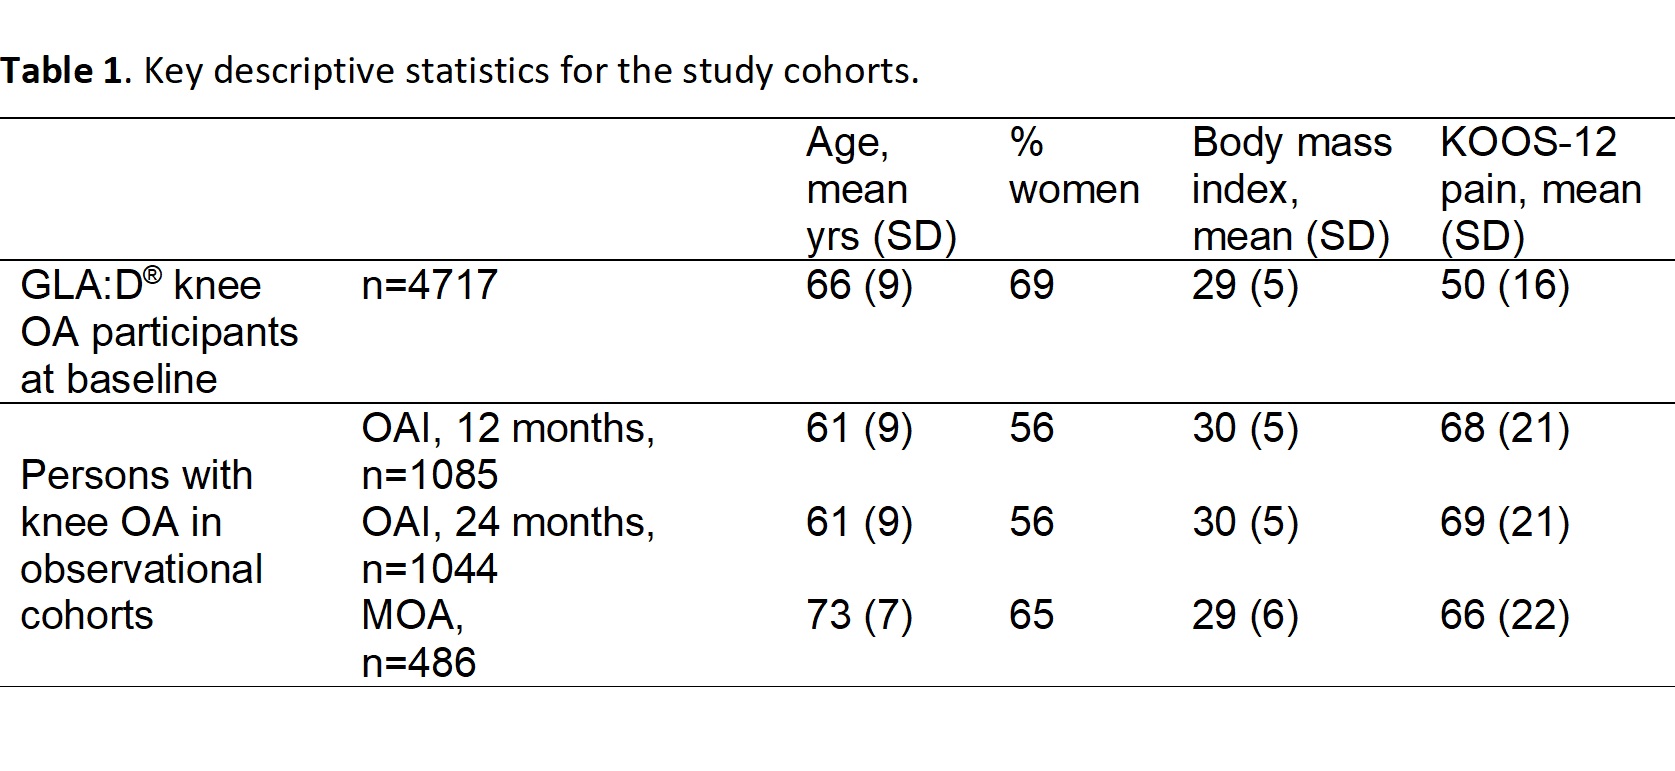
To estimate mean levels of pain in a population of persons with knee OA we used cohort data from the Osteoarthritis Initiative (OAI), USA and the Malmö Osteoarthritis study (MOA), Sweden. From OAI we included subjects with radiographic knee OA (KL grade ≥2) at baseline, 12 or 24 months and reporting knee pain, aching or stiffness on most days of at least one month the past 12 months at the baseline visit. We report KOOS-12 values at 12 and 24 months. MOA consisted of two parts – first, persons responded to a postal questionnaire, later they had a clinical visit when knee X-rays were taken. From MOA, we included subjects who had both signs of OA on X-rays and reported knee pain in the postal questionnaire. Thus, taking the fluctuation of OA symptoms into account, we identified the underlying population of persons with knee OA in both OAI and MOA using data collected at one time point (requiring presence of knee pain). We then evaluated their KOOS-12 pain value at another time point. This means, that although the persons suffer from OA pain, we do not select them by conditioning on current knee pain.
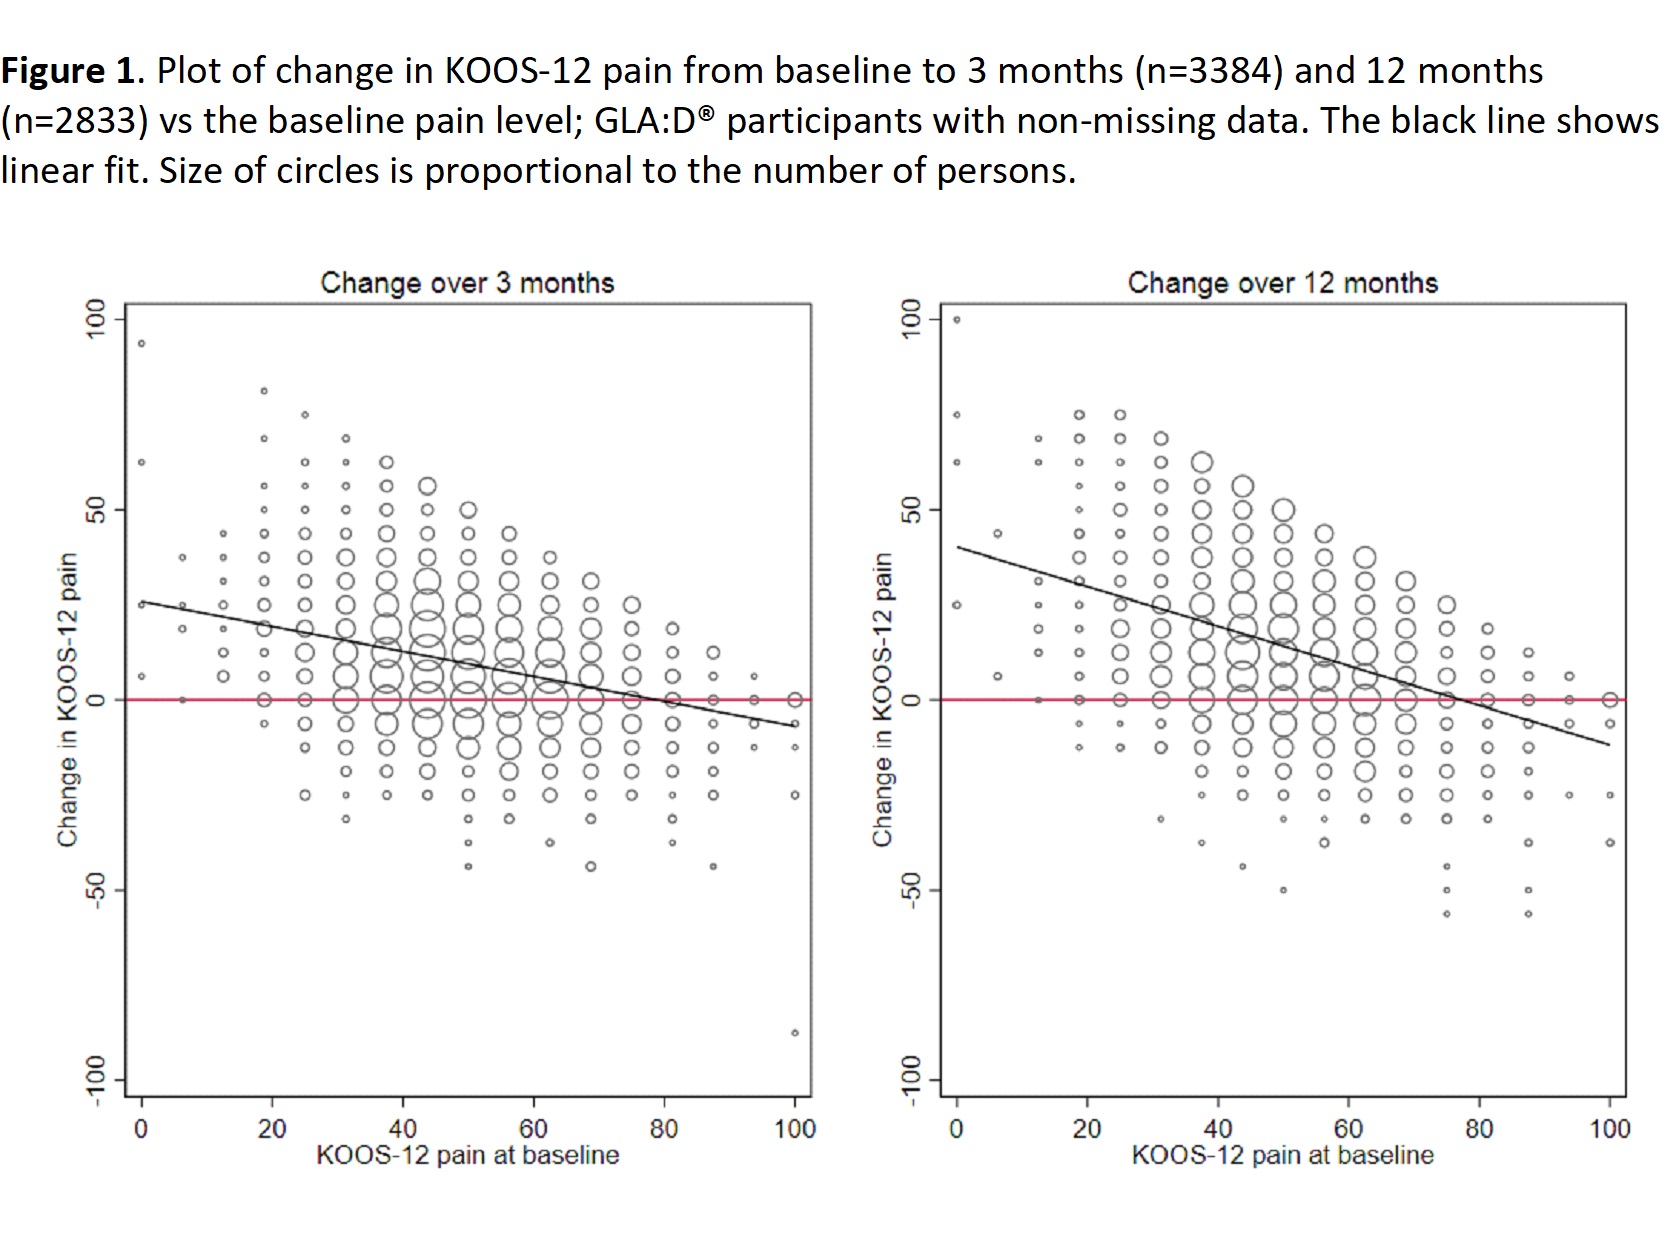
We evaluated two key signs of potential for RTM: 1) worse pain levels in those enrolled in the first-line intervention than in the underlying population with the disease, and 2) negative correlation between baseline values and change as well as greater/lower average improvement among participants with worse/less pain levels compared to the mean baseline value.
Results: The mean KOOS-12 pain level reported at baseline when enrolling in GLA:D® were worse than in persons with knee OA from OAI and MOA by 16 to 19 points (Table 1). Further, in GLA:D® we found a negative correlation between KOOS-12 pain at baseline and its change of ‑0.31 (95%CI ‑0.33, ‑0.27) at 3 months and ‑0.39 (95%CI ‑0.42,‑0.35) at the 12 months follow-up (Fig 1). At 12 months, the persons with baseline KOOS pain ≤50 had improved on average by 19 points, while those with baseline pain >50 had improved on average by 6 points. Corresponding data for change from baseline to 3 months were 13 and 4 points, respectively.
Conclusion: Data from a first-line intervention for knee OA display key signs of RTM. As RTM represents no true improvement, but only reflects natural fluctuations of the symptoms, there is a need to determine its magnitude to better understand the true effectiveness of OA interventions in uncontrolled study designs.
To cite this abstract in AMA style:
Englund M, Grønne D, Roos E, Skou S, Turkiewicz A. Signs of Regression to the Mean in Observational Data from a Nation-Wide Exercise and Education Intervention for Osteoarthritis [abstract]. Arthritis Rheumatol. 2021; 73 (suppl 9). https://acrabstracts.org/abstract/signs-of-regression-to-the-mean-in-observational-data-from-a-nation-wide-exercise-and-education-intervention-for-osteoarthritis/. Accessed .« Back to ACR Convergence 2021
ACR Meeting Abstracts - https://acrabstracts.org/abstract/signs-of-regression-to-the-mean-in-observational-data-from-a-nation-wide-exercise-and-education-intervention-for-osteoarthritis/


