Session Information
Date: Saturday, November 16, 2024
Title: Vasculitis – Non-ANCA-Associated & Related Disorders Poster I
Session Type: Poster Session A
Session Time: 10:30AM-12:30PM
Background/Purpose: Giant cell arteritis (GCA) is a large vessel vasculitis characterized by inflammatory cell infiltration and destruction of the tunica media. In this study, we aim to analyze infiltrating macrophages and multinucleated giant cells (MNGCs) at the molecular level using immunohistochemistry.
Methods: Patients suspected of GCA and underwent temporal artery biopsy (TAB) as the diagnostic procedure before the treatment were recruited. RNA was extracted from the TAB blocks, and genome-wide gene expression profiling was performed. The data were analyzed for gene expression quantification, leading to the identification of differentially expressed genes. The resulting data were examined to reveal specific pathways and genes, and some of the molecules were followed up by immunohistochemistry. Enrichment of biological pathways and cell-type composition was also assessed. Histological and immunohistochemistry methods were employed to analyze tissue samples.
Results: We enrolled 16 untreated patients suspected of GCA who underwent TAB. Ten were diagnosed with GCA, while six were non-GCA. Two of the GCAs revealed atypical histopathology and clinical manifestation. Hematoxylin and eosin staining showed typical GCA cases exhibiting significant macrophage and MNGC infiltration.
Gene expression profiling revealed a clear separation between typical GCA (n=8) and others (n=8) in principal component analysis, with atypical GCA cases being clustered with non-GCA patients. We identified 2,002 upregulated and 1,681 downregulated genes in typical GCA (log2FC > 1, FDR < 0.05). Upregulated genes included those involved in adaptive immune responses (IGLL5, MZB1, JCHAIN, CTLA4) and macrophage-associated genes (CHI3L1, MARCO, FBP1). Cell-type enrichment analysis indicated significant contributions from CD4+ T cells, CD8+ T cells, macrophages, and multipotent progenitors. Pathway analysis highlighted enrichment in immune pathways, particularly those related to microglia and osteoclast differentiation, including markers like ACP5, MMP9, and DCSTAMP (Fig.1).
Immunohistochemistry confirmed that the MNGCs and surrounding macrophages in the tunica media strongly expressed MRC1 (CD206), a marker for tissue-remodeling macrophages. LRRC15, a marker of myofibroblasts suppressing cytotoxic CD8+ T cell, expressed in the myofibroblasts. Osteoclast markers ACP5 and ATP6V0D2 were explicitly expressed in MNGCs, not macrophages. VDR and TREM2 were detected in MNGCs and macrophages of GCA samples, indicating osteoclast-like properties in these cells. MMP12, a macrophage elastase involved in extracellular matrix degradation, was highly upregulated in MNGCs. HLA-DRA was present in MNGCs and macrophages, underlining their role in immune-stimulatory functions (Fig.2).
Conclusion: Infiltrating macrophages and MNGCs expressed MMP12, phagocytic or osteoclast-associated molecules that contribute to the pathogenetic features of GCA, including degradation of the tunica medium, induction of immune responses, and accumulation of myofibroblasts. The extended list of key molecules provides a solid baseline for elucidating the pathogenesis of GCA and developing therapeutic strategies.
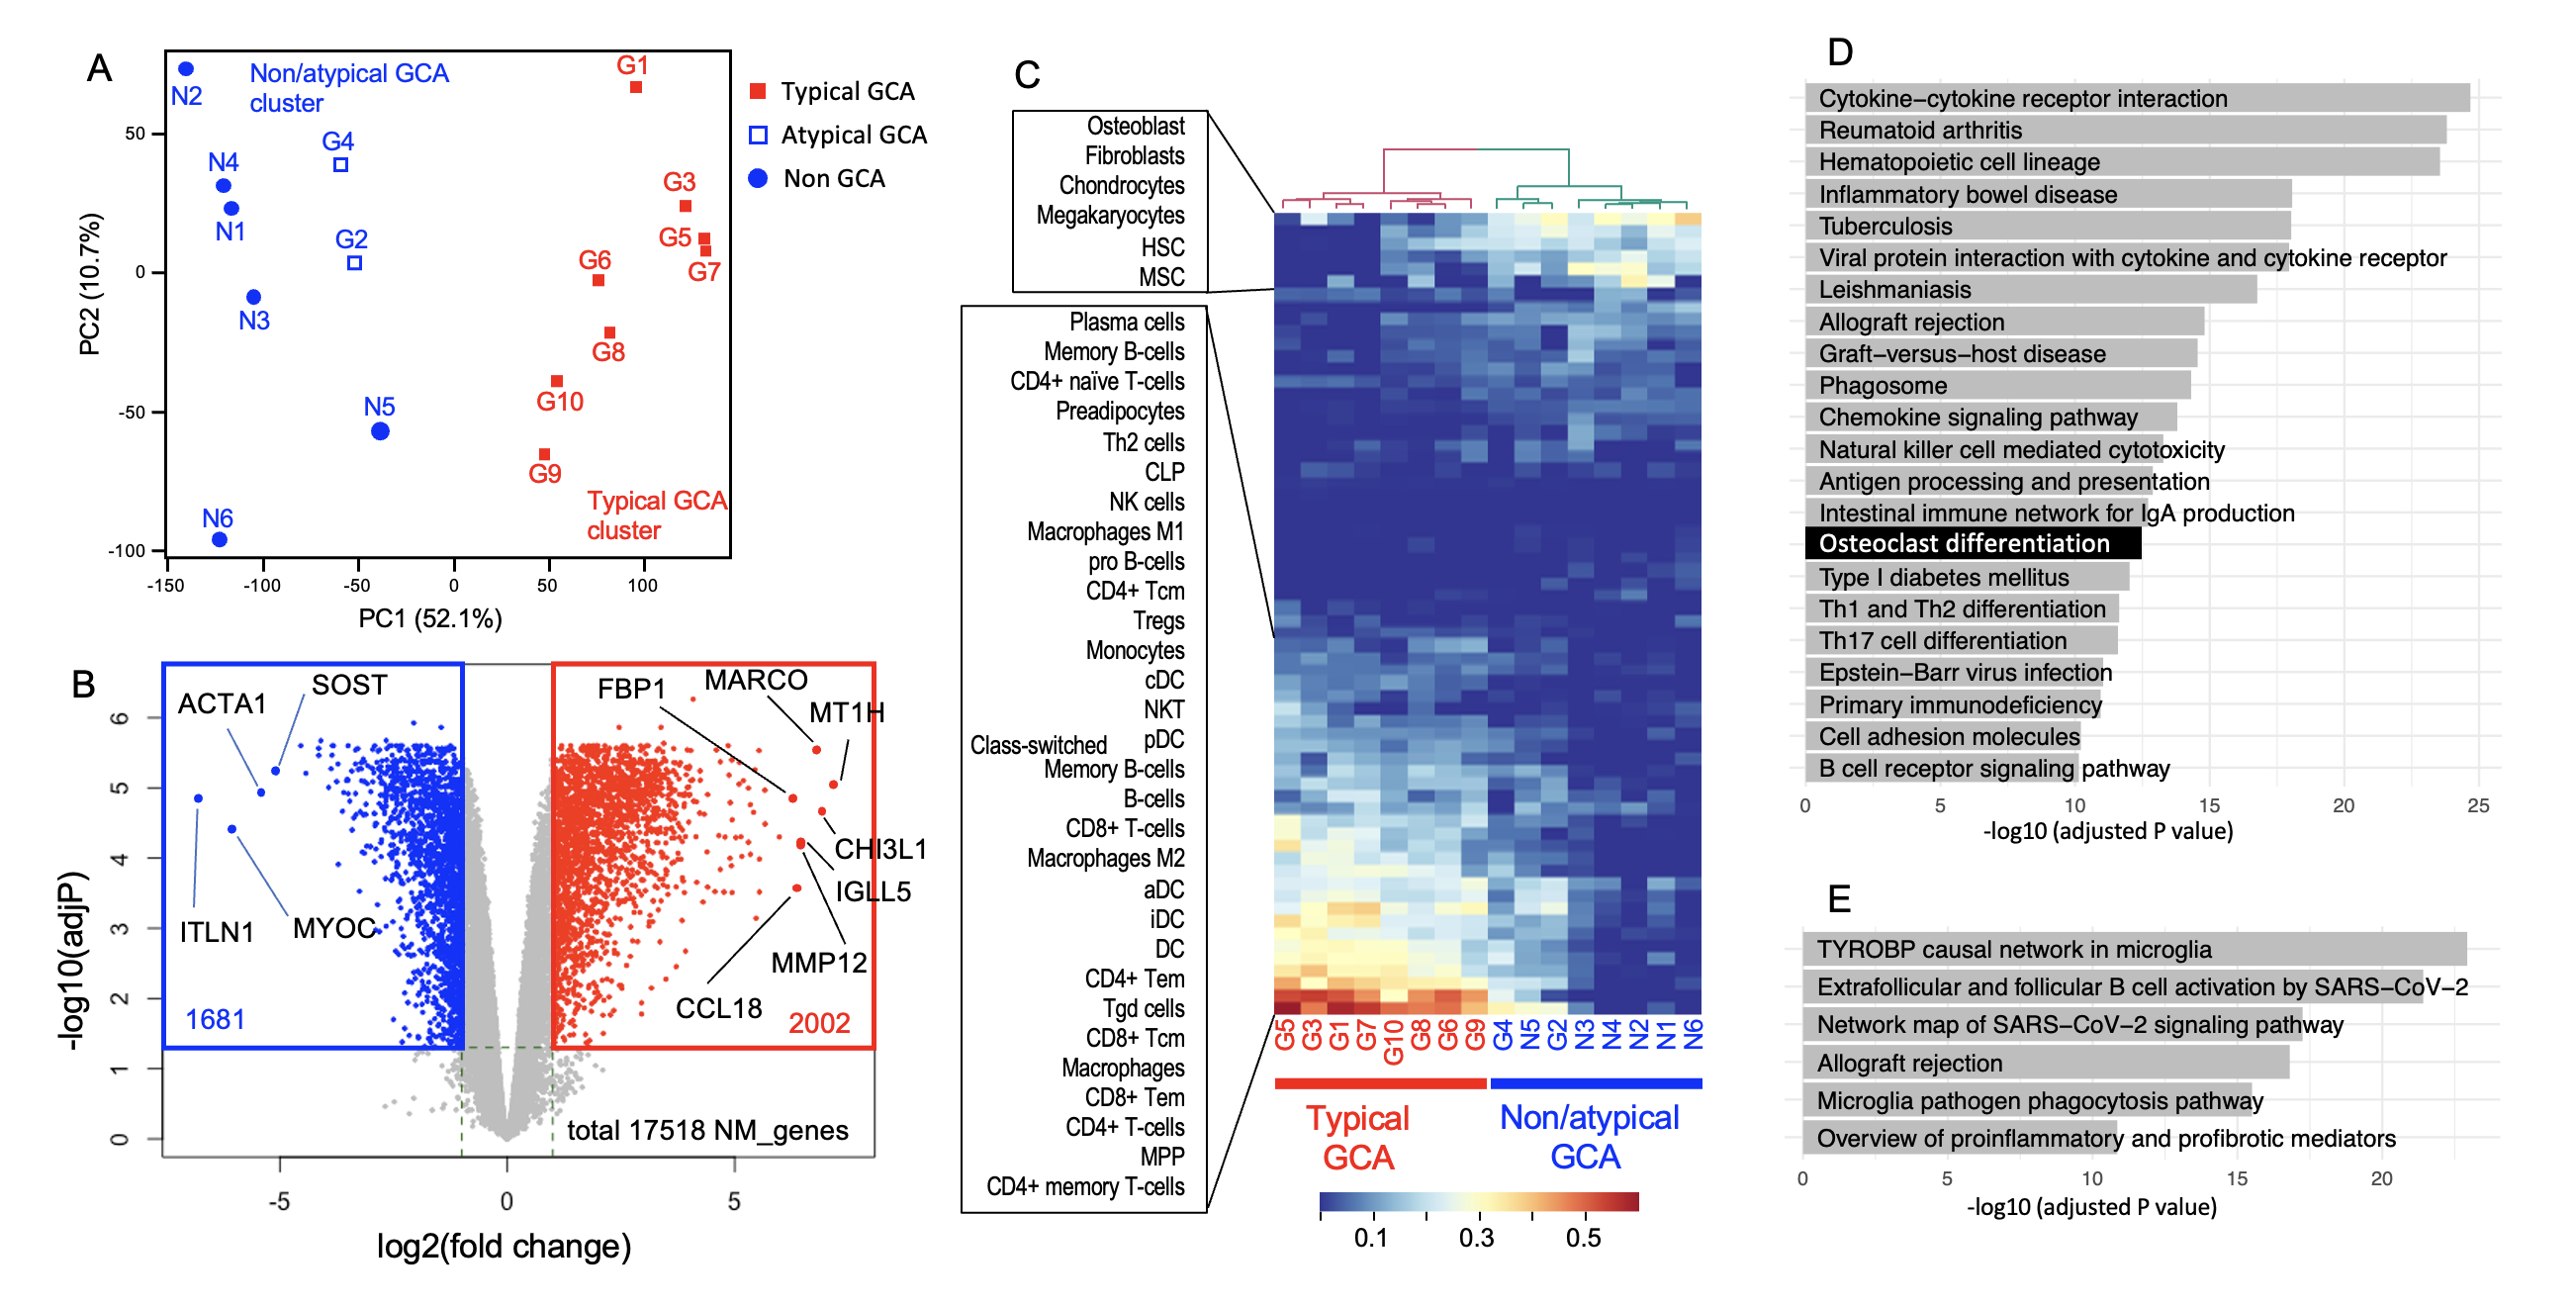
(A) Principal component analysis (PCA) of the transcriptomes derived from GCA and non-GCA TAB specimens. Each dot represents a single specimen, which is categorized as typical, atypical or non-GCA. The result of K-means clustering (k = 2) was shown by color (blue and red).
(B) Volcano plot comparing differentially expressed genes (DEGs) between the typical GCA cluster and non-GCA/atypical GCA cluster. Gray, not significantly differentially expressed; red, upregulated in typical GCA (log2FC > 1 and false discovery rate (FDR) < 0.05); blue, downregulated in typical GCA (log2FC < −1 and FDR < 0.05). P values were calculated by FDR-corrected empirical Bayes moderated T statistics in the R package Limma. Only protein coding genes are shown. The positions and names of several representative genes are indicated in black. ACTA1, actin alpha 1, skeletal muscle; CCL18, C-C motif chemokine ligand 18; CHI3L1, chitinase 3-like 1; FBP1, fructose-bisphosphatase 1; IGLL5, immunoglobulin lambda-like polypeptide 5; ITLN, intelectin 1; MARCO, macrophage receptor with collagenous structure; MMP12, matrix metallopeptidase 12; MT1H, metallothionein 1H; MYOC, myocilin; SOST, sclerostin.
(C) Estimation of the cellular composition of TABs, with a heatmap showing hierarchical clustering of the specimens. The xCell platform was used for the analysis. (D) Enrichment analysis of the Kyoto Encyclopedia of Genes and Genome (KEGG) biological pathway by using the g:Profiler online tool. Upregulated DEGs (2858 genes; FDR, <0.05 and log2FC>1) were used for the analysis, and significant pathways (adjusted P, <1 x 10e_10) are shown.
(E) The Wikipathways database was used to analyze the same upregulated DEGs as in D. An adjusted P value of less than 1 × 10e_10 was used as the threshold.
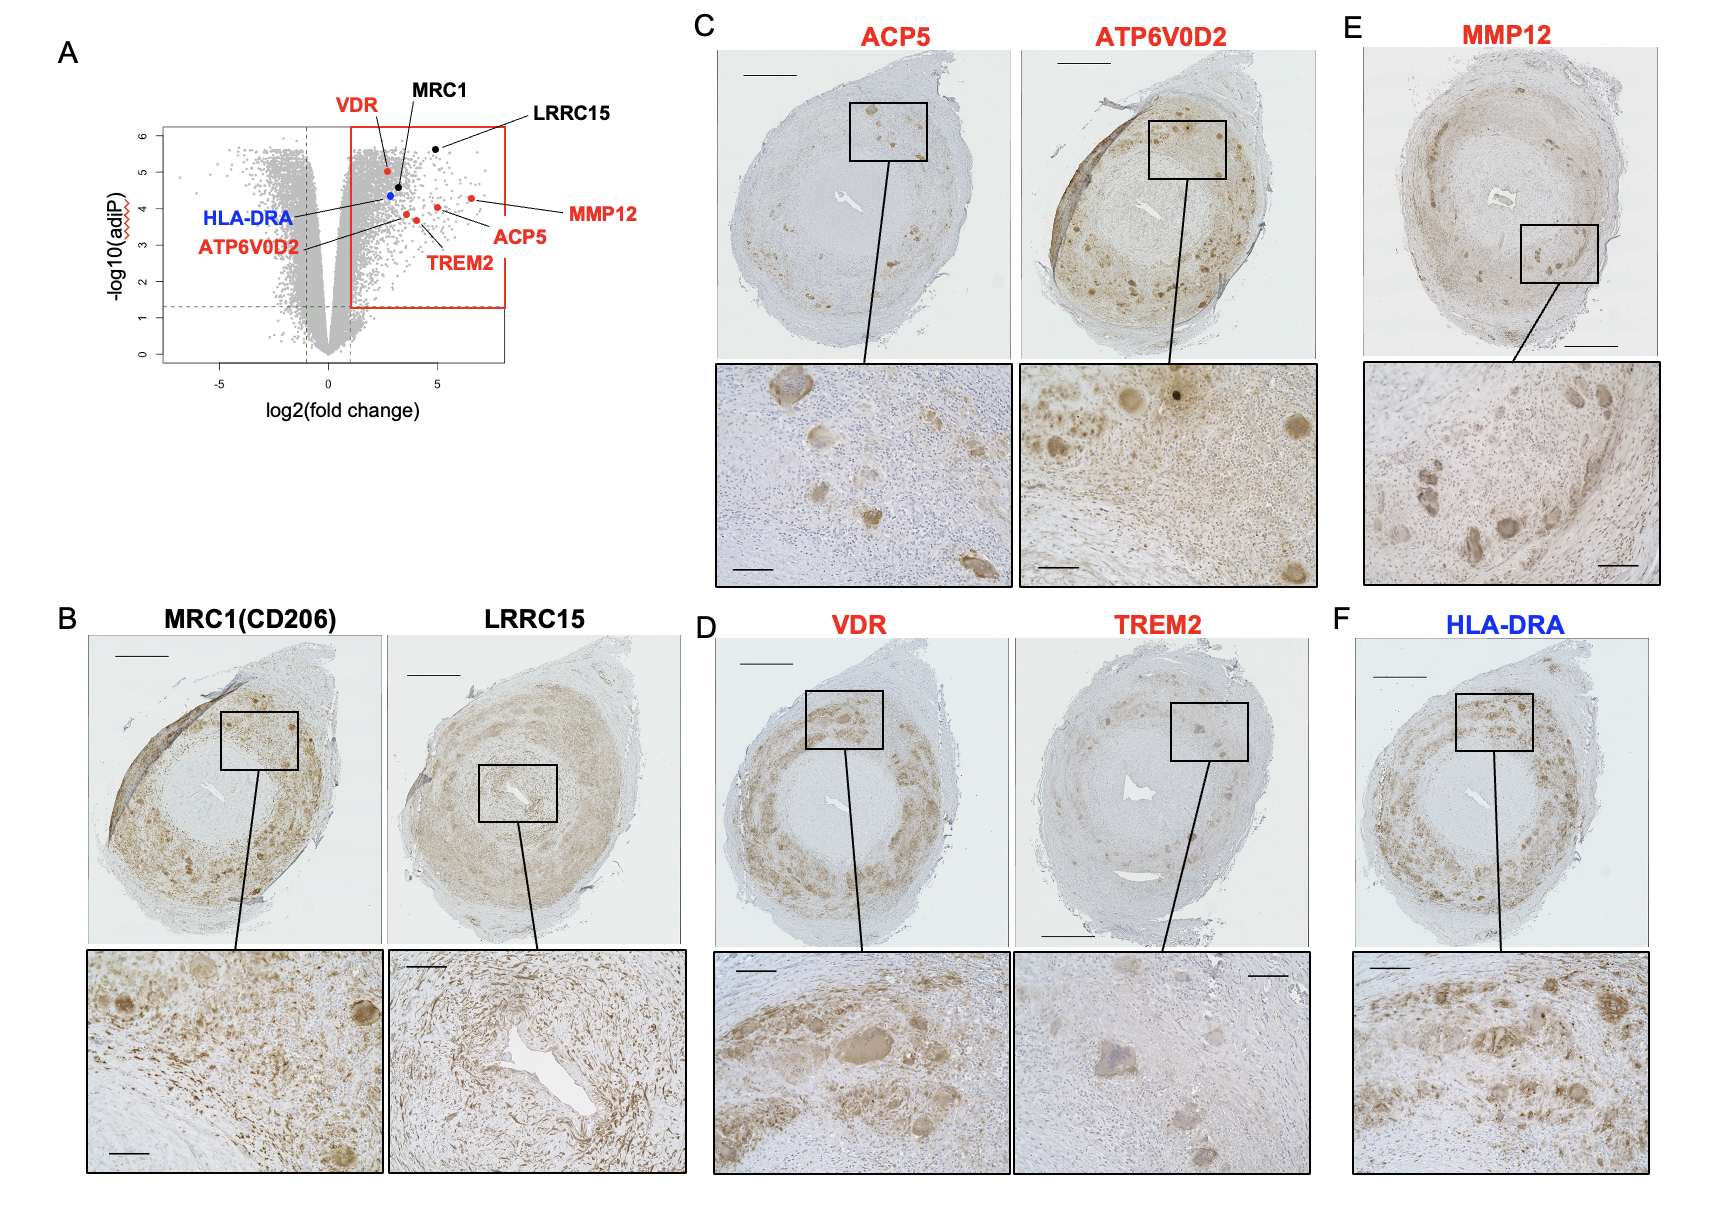
(A) The upregulated genes examined by immunohistochemistry overlaid on the volcano plot. ACP5, acid phosphatase 5, tartrate resistant; ATP6V0D2, ATPase H+ transporting V0 subunit d2; HLA-DRA, major histocompatibility complex, class II, DR alpha; LRRC15, leucine-rich repeat-containing 15; MRC1, mannose receptor C-type 1; MMP12, matrix metallopeptidase 12; TREM2, triggering receptor expressed on myeloid cells 2; VDR, vitamin D receptor. Black, genes associated with intimal hyperplasia (i.e., LRRC15, MRC1); blue, gene associated with the CD4+ T cell immune response (HLA-DRA); red, genes associated with destruction of the tunica media (i.e., ACP5, ATP6V0D2, MMP12, TREM2, VDR).
(B–F) Formalin-fixed paraffin-embedded specimens of TABs from a representative patient with typical GCA (G7) stained with antibodies to (B) MRC1 and LRRC15, (C) APC5 and ATP6V0D2, (D) VDR and TREM2, (E) MMP12, and (F) HLA-DRA. The experimental conditions, buffer pH used for heat-induced epitope retrieval, and antibody concentrations are summarized in Supplemental Table 5. In each panel, the lower images are magnifications of the boxed area in the upper image. Scale bars: upper images, 500 μm; lower images, 100 μm.
To cite this abstract in AMA style:
Sugihara M, Watanabe N, Hara Y, Nishito Y, Kounoe M, Sekiyama K, Takamasu E, Chinen N, Shimada K, Kawaji H. Macrophage-Lineage Cells in Giant Cell Arteritis Express MMP12, Phagocytosis and Osteoclast-associated Molecules That May Contribute to Destruction of the Tunica Media [abstract]. Arthritis Rheumatol. 2024; 76 (suppl 9). https://acrabstracts.org/abstract/macrophage-lineage-cells-in-giant-cell-arteritis-express-mmp12-phagocytosis-and-osteoclast-associated-molecules-that-may-contribute-to-destruction-of-the-tunica-media/. Accessed .« Back to ACR Convergence 2024
ACR Meeting Abstracts - https://acrabstracts.org/abstract/macrophage-lineage-cells-in-giant-cell-arteritis-express-mmp12-phagocytosis-and-osteoclast-associated-molecules-that-may-contribute-to-destruction-of-the-tunica-media/