Session Information
Session Type: Poster Session A
Session Time: 10:30AM-12:30PM
Background/Purpose: Knee pain and functional limitations are the most common symptoms of knee OA. Understanding the various patterns of symptoms (i.e., pain and function changes over time) can help identify individuals most in need of targeted interventions. Using OAI data, we have previously shown that there are distinct symptom trajectories for knees that start with no symptoms at baseline and there are specific predictors of a worse symptom trajectory. Our objective was to analyze knee symptoms among individuals with or at risk for knee OA with varying degrees of symptoms to identify temporal knee pain and function phenotypes using two large cohorts.
Methods: We selected 2965 knees from MOST, and 9491 knees from OAI that had the following knee pain/function measures available at baseline to develop the knee symptom phenotypes based upon trajectories of these measures over time: WOMAC function, WOMAC pain, and the Numerical Rating Scale (NRS) for knee pain severity. We used data from 0 to the 7th year in MOST, and from 0 to the 9th year in OAI to develop the trajectories. Knees that were already replaced at the baseline visit were excluded. Latent Class Mixed Models (LCMM) were employed to cluster the selected knees into distinct knee pain/function progression trajectories, while simultaneously using logistic regression to identify predictors associated with each trajectory. The response covariance matrix was allowed to be different for each latent class. We used tertiles of the baseline WOMAC function score as strata for LCMM analyses for each of the symptom measures.
Results: In both cohorts, two trajectories for each model were identified as optimal. For each tertile of baseline WOMAC function, the patterns of the trajectories were similar for each of the pain and function outcomes. As a sample illustration, the clusters for WOMAC function by tertile for MOST and OAI are shown in Figure 1. For the lowest tertile, there was a stable trajectory (blue) vs. a rapidly worsening trajectory (red). For the middle tertile, there was an improving trajectory (blue) vs. a worsening trajectory (red). For the highest tertile, both the red and blue clusters showed improving trajectories, but starting at different baseline scores. The ORs for being in the red (i.e., worse/worsening) vs. the blue (i.e., stable or improving) clusters for each tertile are summarized in Figure 2 for MOST and Figure 3 for OAI. The predictors in common across models associated with being in the red (i.e., worse) cluster were widespread pain, overweight/obese, higher Kellgren-Lawrence Grade (KLG), and more depressive symptoms (i.e., Center for Epidemiologic Studies Depression scale, CES-D).
Conclusion: For both MOST and OAI, similar symptom trajectories were identified when the cohorts were stratified using the tertile of the baseline WOMAC function score. We have also identified readily assessable predictors of the worse symptom trajectories. The trajectories with worse symptom progression may represent a group to target with interventions earlier in their disease course.
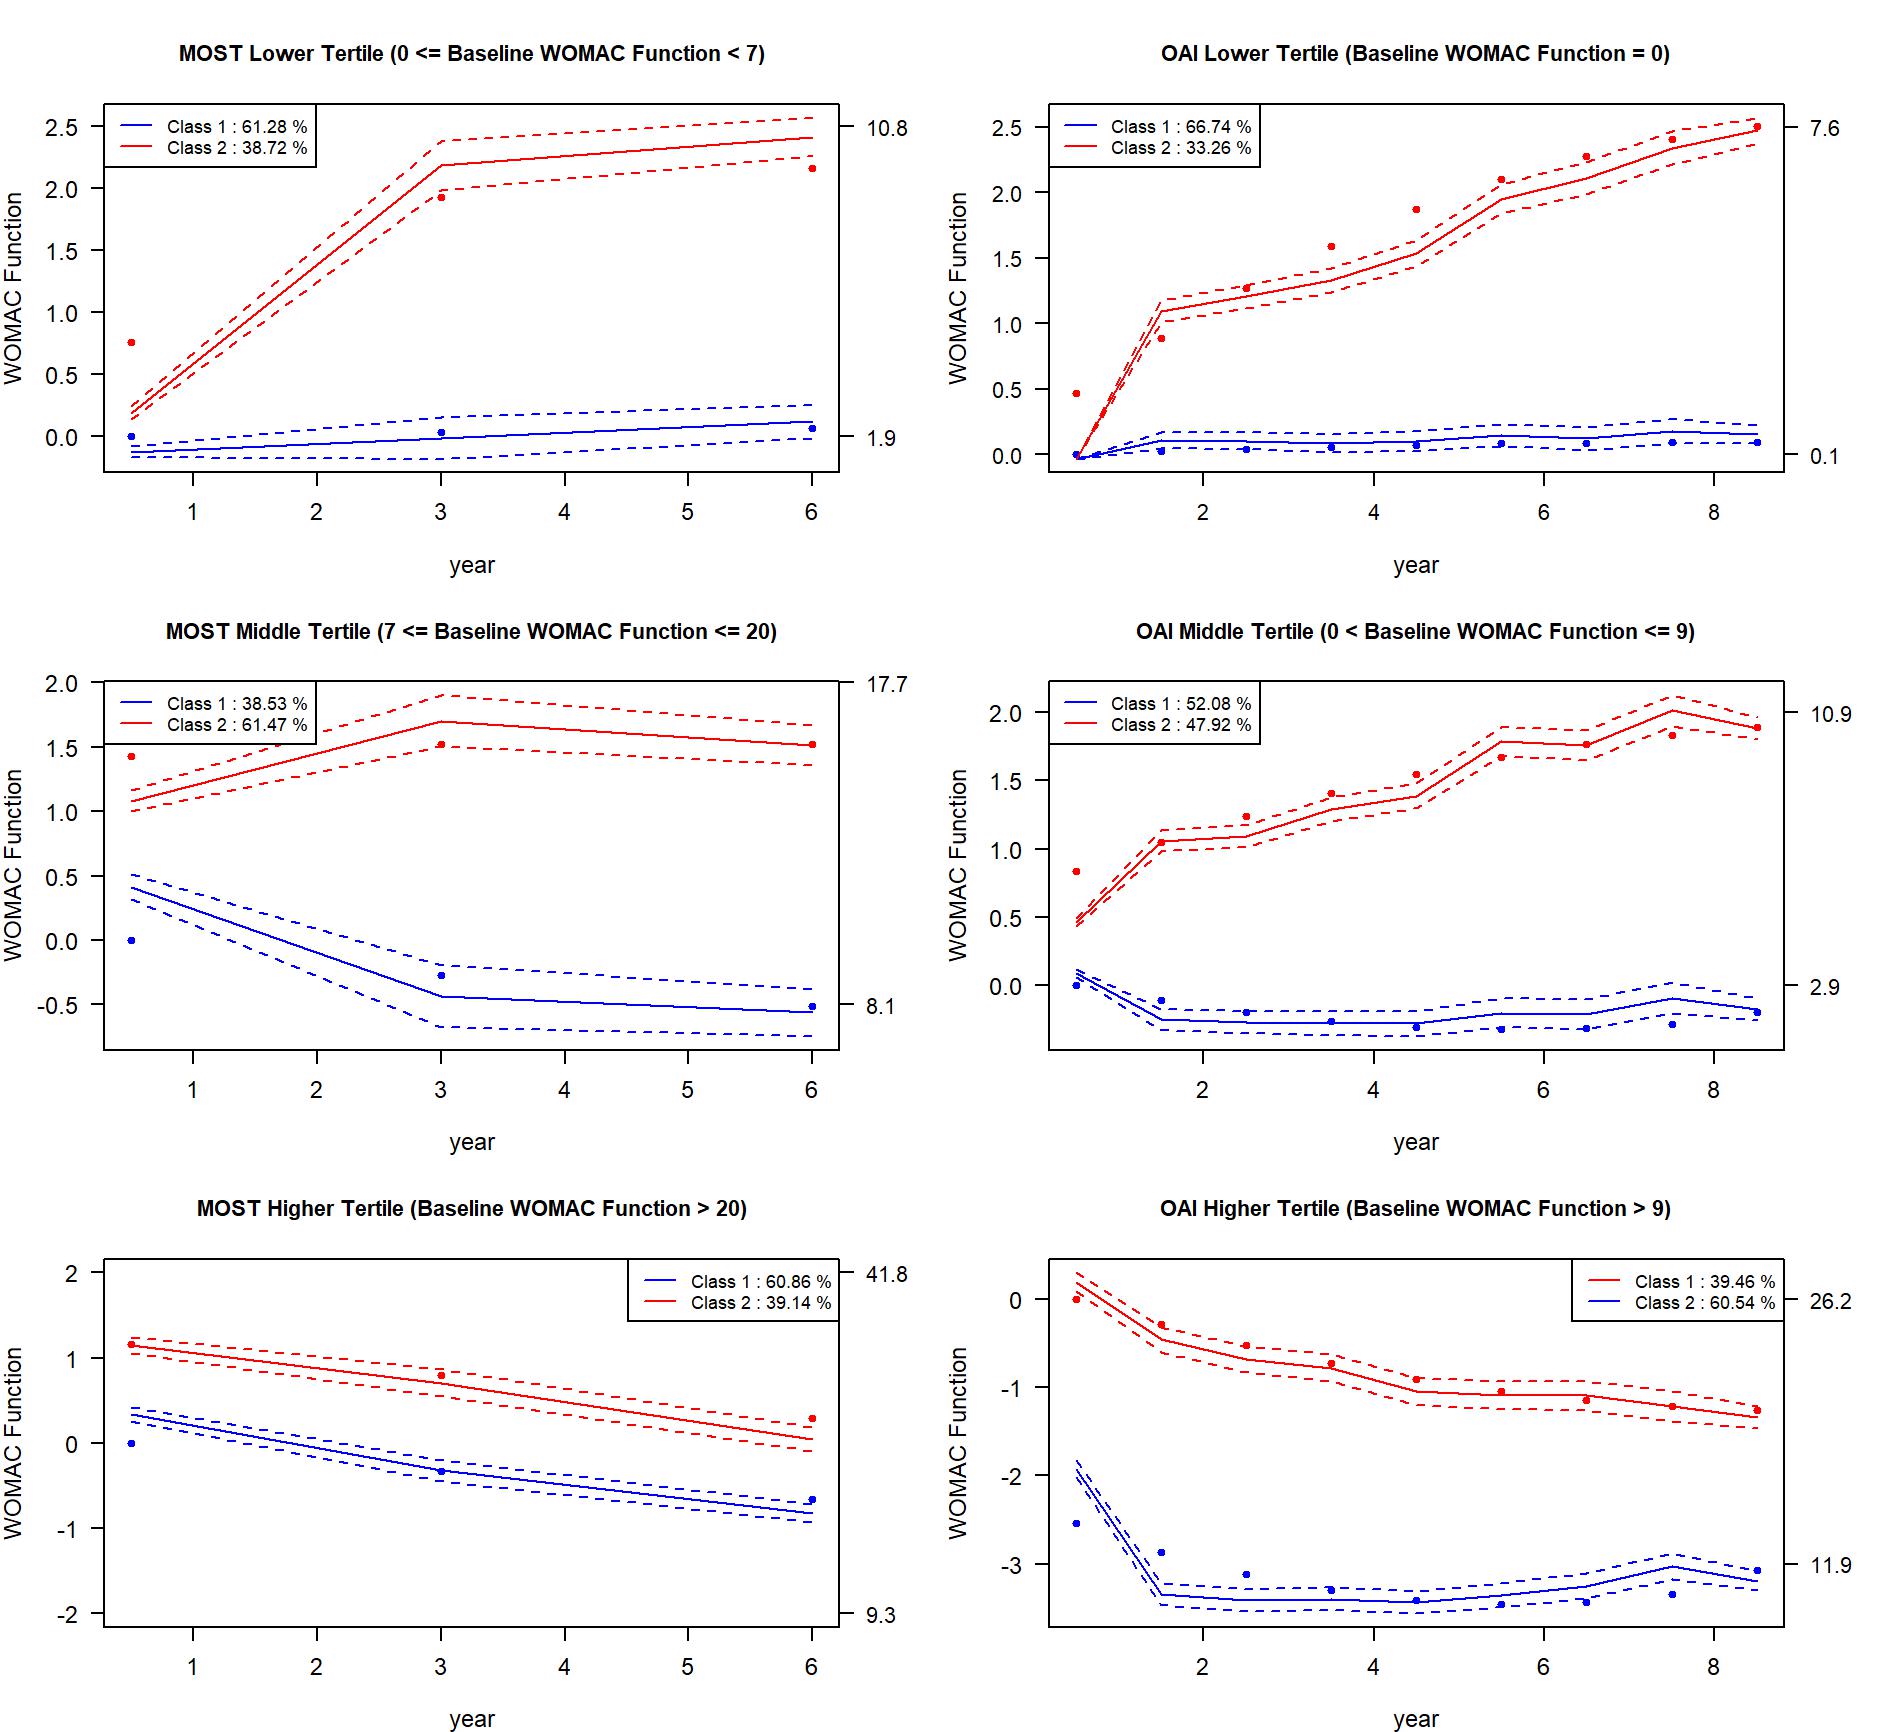 Figure 1. Knee symptom phenotyping by tertiles of baseline WOMAC function score for OAI and MOST
The average trajectory (solid line) and confidence intervals (dashed lines) for WOMAC function are shown. The left column shows the trajectory results for OAI, and the right column show the trajectory results for MOST. Each row shows the tertile-specific cluster trajectories by strata of baseline WOMAC function score by tertile. The left-sided y-axis is the latent process WOMAC function score transformed using the link function. The right-sided y-axis is the actual WOMAC function score.
.jpg) Figure 2. Summary of the predictors for being in the Red Trajectory (i.e., worse/worsening) vs. the Blue Trajectory (i.e., stable/improving) [in Figure 1] by tertiles of baseline WOMAC function score for MOST
Figure 2. Summary of the predictors for being in the Red Trajectory (i.e., worse/worsening) vs. the Blue Trajectory (i.e., stable/improving) [in Figure 1] by tertiles of baseline WOMAC function score for MOST
WSP = widespread pain; KL = Kellgren-Lawrence; CES-D_SD = Center for Epidemiologic Studies Depression scale by standard deviation
OR of KL 3, 4 for the highest tertile is 99.48, with CI [5.26, 1881.83]. This information was not included in the plot due to scale issues.
.jpg) Figure 3. Summary of the predictors for being in the Red Trajectory (i.e., worse/worsening) vs. the Blue Trajectory (i.e., stable/improving) [in Figure 1] by tertiles of baseline WOMAC function score for OAI
Figure 3. Summary of the predictors for being in the Red Trajectory (i.e., worse/worsening) vs. the Blue Trajectory (i.e., stable/improving) [in Figure 1] by tertiles of baseline WOMAC function score for OAI
WSP = widespread pain; KL = Kellgren-Lawrence; CES-D_SD = Center for Epidemiologic Studies Depression scale by standard deviation
To cite this abstract in AMA style:
Kwoh C, Nelson A, Tang R, Bedrick E, Ge Y, Golightly Y, Li Z, Liew J, Sun X, Duryea J, Neogi T. Knee Symptom Phenotyping Incorporating Pain and Function across Different Levels of WOMAC Function in Two Cohorts: Data from the Multicenter Osteoarthritis Study (MOST) and the Osteoarthritis Initiative (OAI) [abstract]. Arthritis Rheumatol. 2025; 77 (suppl 9). https://acrabstracts.org/abstract/knee-symptom-phenotyping-incorporating-pain-and-function-across-different-levels-of-womac-function-in-two-cohorts-data-from-the-multicenter-osteoarthritis-study-most-and-the-osteoarthritis-initiati/. Accessed .« Back to ACR Convergence 2025
ACR Meeting Abstracts - https://acrabstracts.org/abstract/knee-symptom-phenotyping-incorporating-pain-and-function-across-different-levels-of-womac-function-in-two-cohorts-data-from-the-multicenter-osteoarthritis-study-most-and-the-osteoarthritis-initiati/