Session Information
Date: Monday, October 27, 2025
Title: (1306–1346) Rheumatoid Arthritis – Diagnosis, Manifestations, and Outcomes Poster II
Session Type: Poster Session B
Session Time: 10:30AM-12:30PM
Background/Purpose: Rheumatoid arthritis (RA) is an autoimmune polyarthritis that typically affects the small joints of the hands and feet. While imaging modalities such as ultrasound and MRI are valuable for detecting synovitis, their use can be limited by technical requirements and cost. Thermography is a non-invasive imaging technique that captures pixel-level temperature data and has seen growing interest in the assessment of inflammatory arthritis. We aimed to determine if thermal imaging of the hands and feet can effectively distinguish RA patients from healthy controls (HC).
Methods: RA patients were recruited from an academic rheumatology clinic (Winnipeg, Canada). Healthy controls (HC) were recruited through advertising. Thermal images of the dorsal aspects of the hands and feet were captured with a Flir A700 camera. Regions of interest (ROI) were pre-identified as joints commonly affected in RA (Fig1A). ROIs were manually gated, and the max/min/average temperatures were extracted. Data analysis was performed in R to identify temperature differences between groups, followed by machine learning classification. Thermograms were also analyzed using a deep learning model which deployed unsupervised feature extraction (DINOV2) and classification (ElasticNet) in Python.
Results: We recruited 100 RA patients and 137 HC (Fig1B). Principle components analysis using ROI thermogram data revealed clear separation between RA and HC (Fig2A). Differential analysis identified 56 of 114 temperature parameters that were significantly higher in RA patients, for example the maximum temperatures of the right 5th PIP joint (adjusted p=1.3×10⁻⁸) and right 4th PIP joint (adjusted p=7.6×10⁻⁸). All thermogram parameters (min, max, avg) were increased in joints that were tender or swollen on clinical examination in RA (Fig2C, all p-value < 0.0001). Using thermogram ROI data, XGboost achieved an AUC of .869 to classify RA from control (test set, Fig3A). Rankings of variable importance by SHAP index included average temperatures of L ankle, L Wrist and L 3rd PIP (Fig3B). A computer vision model achieved high performance in classifying RA from controls using entire thermograms (without ROI information), with an AUC of 0.977 and recall of 0.909 (Fig. 3C). Principal components from this model were mapped to red, green, and blue channels to visualize thermographic differences between RA and control subjects (Fig. 3D).
Conclusion: Thermal imaging is an inexpensive and readily accessible method for detecting synovitis in the small joints of the hands and can readily discriminate the hand joint of a spectrum of RA patients from those of unaffected healthy controls. As such, this modality may be a cost-effective approach to detecting subtle joint inflammation at the earliest stages of RA onset, for example in individuals with clinically suspect arthralgia.
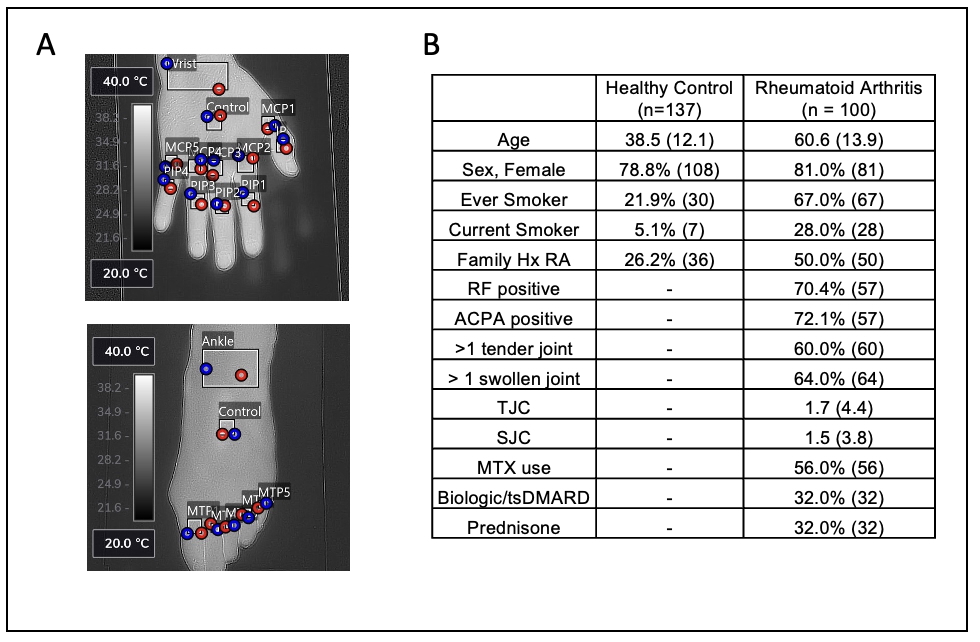 Figure 1 – Thermography of RA patients and healthy controls. (A) Example of thermal images of dorsal hands and feet with gating for regions of interest (ROI). (B) Baseline demographics.
.jpg) Figure 2: Joint thermography distinguishes RA from healthy controls. (A) Principal components analysis of thermal ROIs. (B) Volcano plot of differential thermal ROI parameters comparing RA and control. (C) Comparison (t-test) of thermal parameters between clinically tender joints (upper) and swollen joints (lower).
Figure 2: Joint thermography distinguishes RA from healthy controls. (A) Principal components analysis of thermal ROIs. (B) Volcano plot of differential thermal ROI parameters comparing RA and control. (C) Comparison (t-test) of thermal parameters between clinically tender joints (upper) and swollen joints (lower).
.jpg) Figure 3 – Machine learning to classify RA and controls using thermography. (A) Receiver operator curves derived from an XGboost classifier algorithm (B) SHAP value of the top 6 most important features to classify RA from controls. (C) Summary tables of classifier models used after feature extraction using DINOV2 and multiple classification approaches. (D) Thermal images colorized based on the top 3 features extracted using ElasticNet in the channels red, green and blue.
Figure 3 – Machine learning to classify RA and controls using thermography. (A) Receiver operator curves derived from an XGboost classifier algorithm (B) SHAP value of the top 6 most important features to classify RA from controls. (C) Summary tables of classifier models used after feature extraction using DINOV2 and multiple classification approaches. (D) Thermal images colorized based on the top 3 features extracted using ElasticNet in the channels red, green and blue.
To cite this abstract in AMA style:
Mayor K, Mercier J, Long Y, Robinson D, Hu P, El-Gabalawy H, O'Neil L. High-resolution thermography and Artificial Intelligence to evaluate and classify Rheumatoid Arthritis [abstract]. Arthritis Rheumatol. 2025; 77 (suppl 9). https://acrabstracts.org/abstract/high-resolution-thermography-and-artificial-intelligence-to-evaluate-and-classify-rheumatoid-arthritis/. Accessed .« Back to ACR Convergence 2025
ACR Meeting Abstracts - https://acrabstracts.org/abstract/high-resolution-thermography-and-artificial-intelligence-to-evaluate-and-classify-rheumatoid-arthritis/