Session Information
Date: Wednesday, November 13, 2019
Title: 6W023: Systemic Sclerosis & Related Disorder – Clinical III: Predictors of Outcome (2912–2917)
Session Type: ACR Abstract Session
Session Time: 11:00AM-12:30PM
Background/Purpose: Population mortality studies in the United States have previously reported a progressive increase in the scleroderma (SSc) mortality rates from 1959 to 2002. Identification of areas with clusters of higher mortality rates is important to implement targeted interventions and may provide clues about possible etiology factors, especially environmental. In this study, we aimed to estimate the mortality rates of patients with SSc and to determine whether there is a geographic variability in scleroderma mortality rates at the state level in the United States using publicly available data from 1999 to 2017.
Methods: To obtain mortality rates of scleroderma as the underlying cause of death, we used the CDC Wonder Underlying Cause of Death database and its query system, which contains data from 1999 to 2017. We used the corresponding ICD-10 codes for SSc for the queries. Age-adjusted rates were calculated by state and demographics, including, gender, race, and Hispanic ethnicity. Mortality rates were given as number of deaths per million. A linear regression model was applied to evaluate trends over time.
Results: During the 19-year period of our study, a total of 24,525 deaths had SSc as the underlying cause of death of an underlying population of 5,761,465,567. The age-adjusted mortality rate was 3.962 per million (95% CI: 3.912-4.012). The SSc-related mortality rates have progressively decreased from a rate of 4.679 (95%CI: 4.423 – 4.934) in 1999 to 2.993 (95% CI: 2.817 – 3.170) per million in 2017. Linear regression found a significant negative slope, indicating a trend to the decrease of age-adjusted mortality rates over time (Age-adjusted rate = – 0.1015*year + 207.8; p < 0.0001) (Figure 1).
There were more deaths in females than in males with a ratio: 4.1 to 1. The age-adjusted mortality rate was 5.885 (95% CI: 5.802 – 5.967) per million in females and 1.651 (95% CI: 1.604 – 1.698) per million in males. The highest age-adjusted mortality rate was in Blacks or African-Americans, at 5.703 per million (95% CI: 5.521 – 5.885), followed by American Indians or Alaska Native at 5.047 per million (95% CI: 4.428 – 5.667) (Table 1). Clusters of contiguous states with higher and lower mortality rates were identified. South Dakota was the state with the highest whereas Hawaii was the one with the lowest mortality rate. In Table 2, we list the states with the highest mortality rates.
Conclusion: Our study found a trend towards a decrease of mortality rate in SSc compared to previous studies, and a trend to a progressive decrease in mortality rates during the years of our study. In addition, we found relevant state-by-state variation in mortality with several geographical clusters with higher mortality rates. Further analyses of those geographical clusters are warranted in order to better understand the factors associated to the observed geographic disparities and to implement targeted interventions to decrease disparities.

Figure 1 Mortality and Scleroderma_ACR_2019
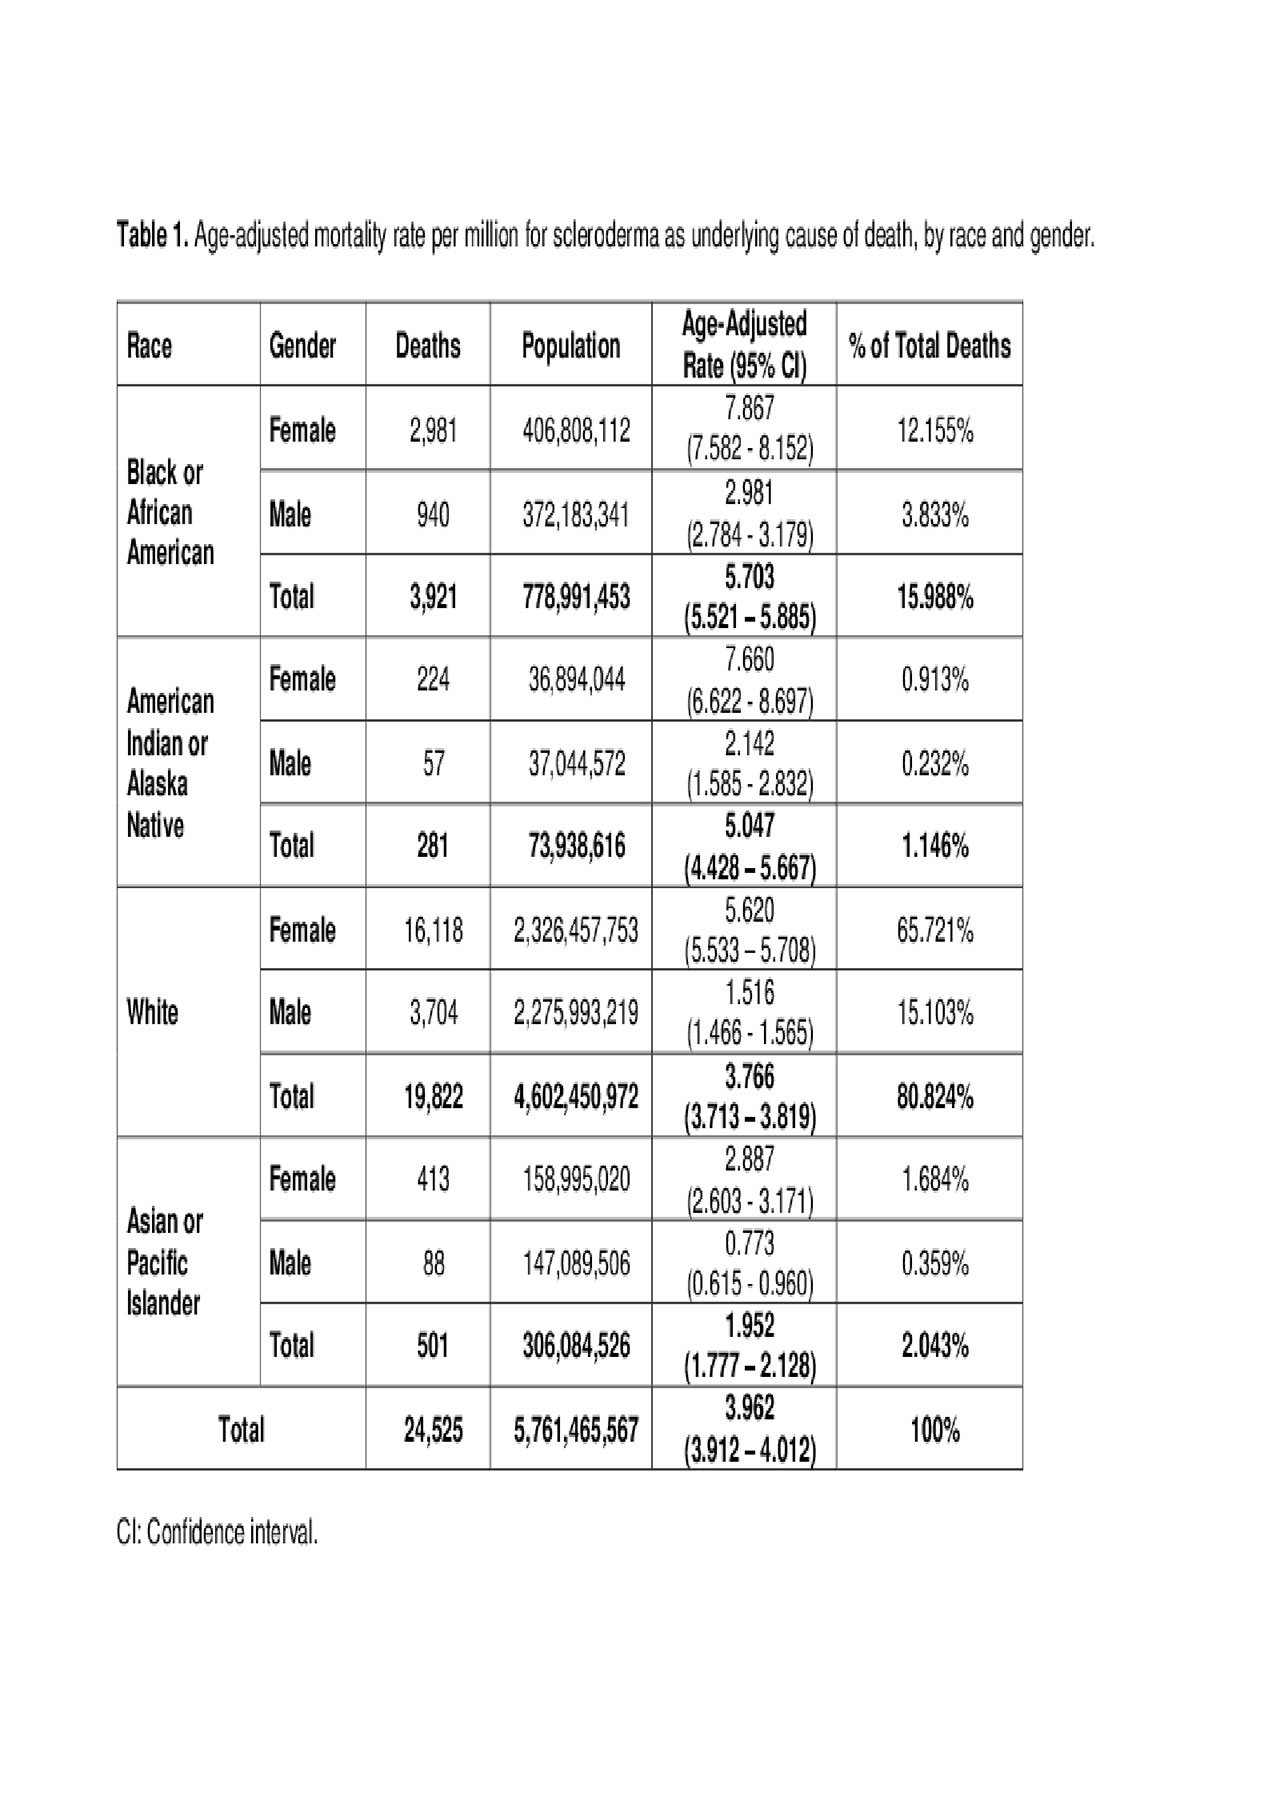
Table 1_Mortality and Scleroderma_ACR 2019
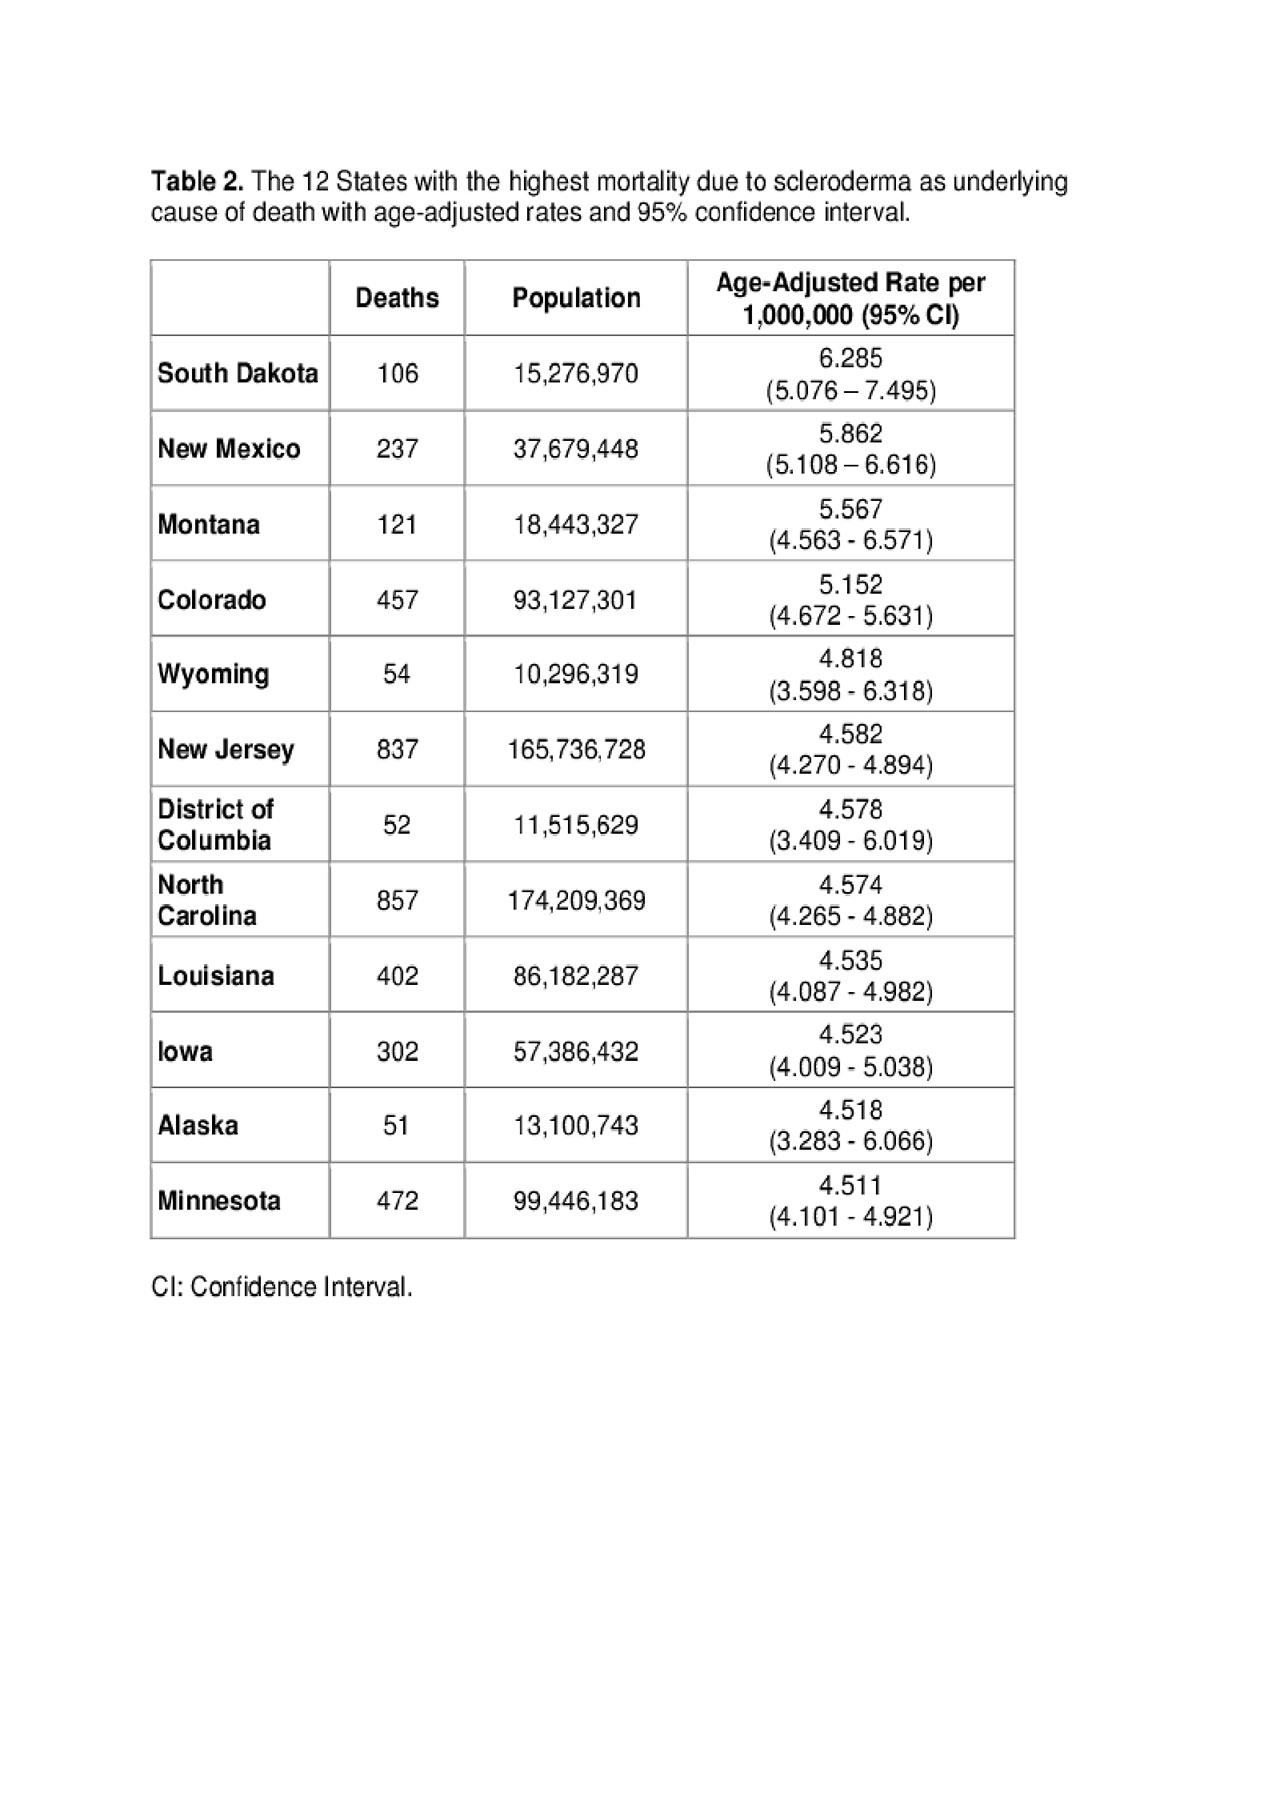
Table 2 Mortality and Scleroderma_ACR 2019
To cite this abstract in AMA style:
Rodriguez-Pla A, Simms R. Geographic Disparities in Systemic Sclerosis Mortality in the United States: 1999 to 2017 [abstract]. Arthritis Rheumatol. 2019; 71 (suppl 10). https://acrabstracts.org/abstract/geographic-disparities-in-systemic-sclerosis-mortality-in-the-united-states-1999-to-2017/. Accessed .« Back to 2019 ACR/ARP Annual Meeting
ACR Meeting Abstracts - https://acrabstracts.org/abstract/geographic-disparities-in-systemic-sclerosis-mortality-in-the-united-states-1999-to-2017/