Session Information
Session Type: Poster Session B
Session Time: 9:00AM-11:00AM
Background/Purpose: Gout and hyperuricemia (HU), serum urate (SU) > 6.8 mg/dL, often present in the context of chronic kidney disease. It has long been known that estimated glomerular filtration rate (eGFR) and SU levels are correlated. Recent GWAS studies of SU and eGFR indicate nine overlapping large effect variants including GCKR, A1CF, and VEGFA, which suggests that the traits are also correlated genetically. Here we estimate the local genetic covariance of eGFR/SU across the genome and test whether expression quantitative trait loci (eQTL) are a potential source of the shared genetic effects on eGFR/SU.
Methods: We computed eGFR/SU genetic covariance estimates from the UK Biobank, consisting of SNP genotypes and clinical data measured on a total of 333,542 unrelated individuals, all of European ancestry. Estimates were generated from sets of SNPs comprising 511,828 genomic windows distributed across the genome. SNPs were included in the same window if they had pairwise linkage disequilibrium (LD) greater than 0.1. Genetic covariance was computed using estimates of variance explained by sets of SNPs on the outcomes from three separate models: 1) eGFR alone 2) SU alone 3) eGFR + SU. Variances were estimated using Bayesian inference, and bootstrap 95% confidence intervals of selected covariance estimates were generated. The Gene and Tissue Expression (GTEx) database (version 8) was used to test cis-eQTLs for variants comprising windows with significant covariance estimates on eGFR/SU. Colocalization of eQTL and GWAS signals was assessed using COLOC.
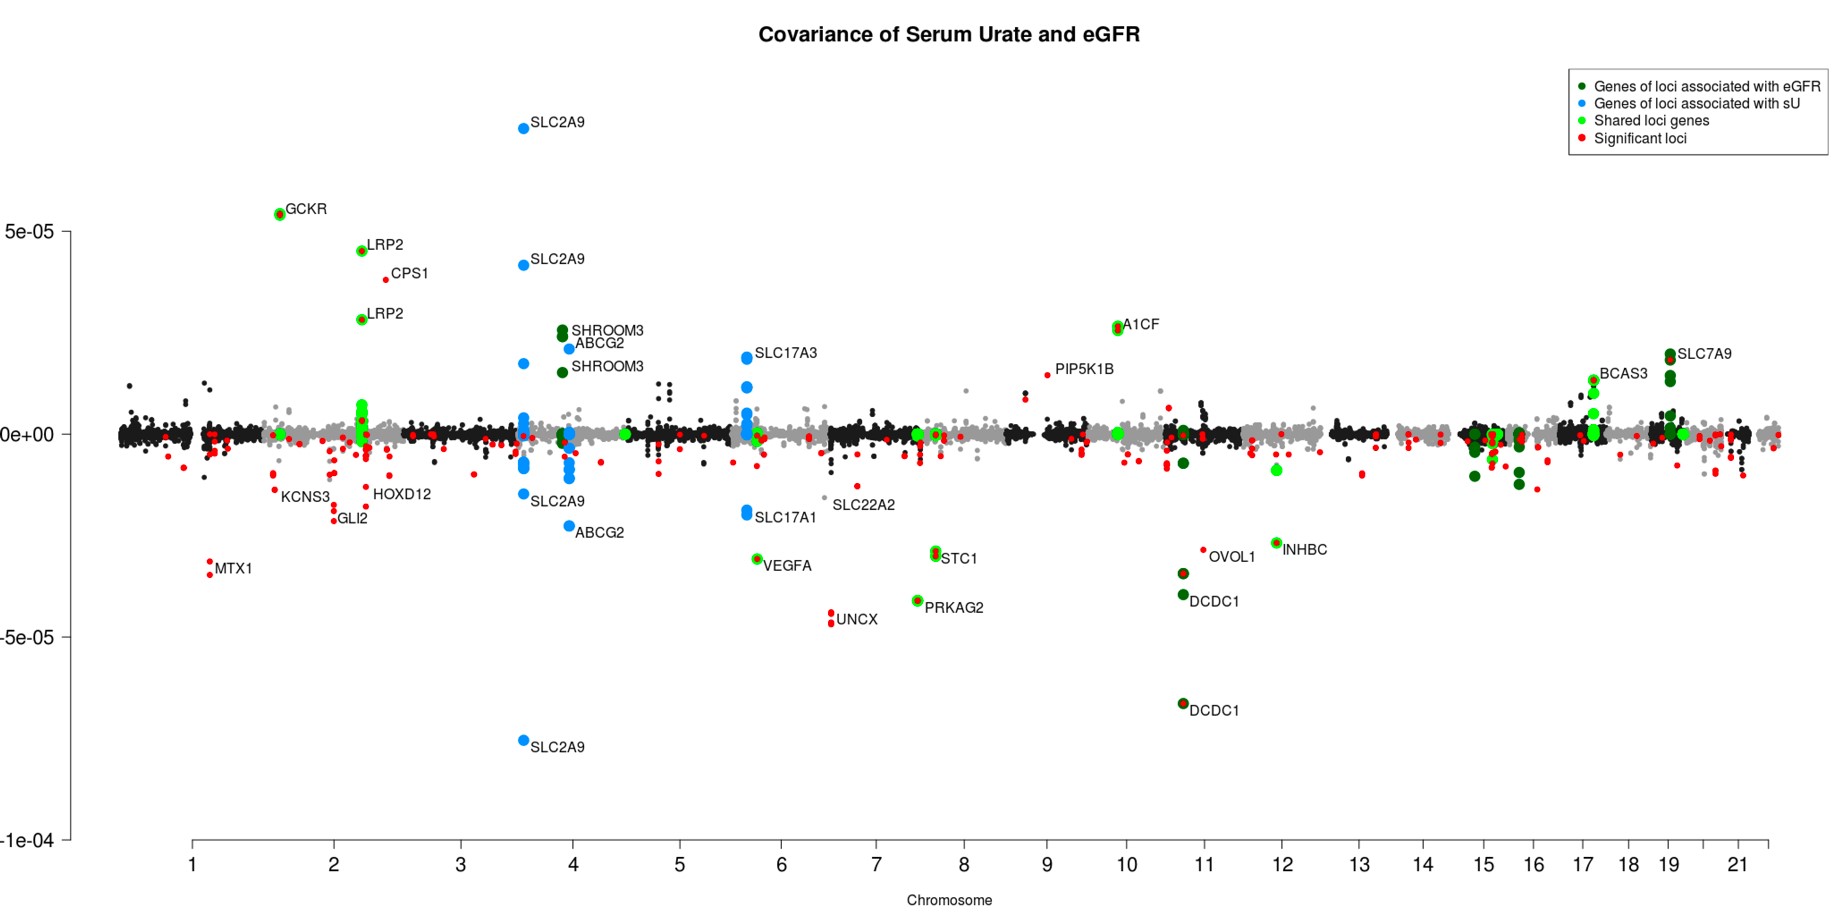
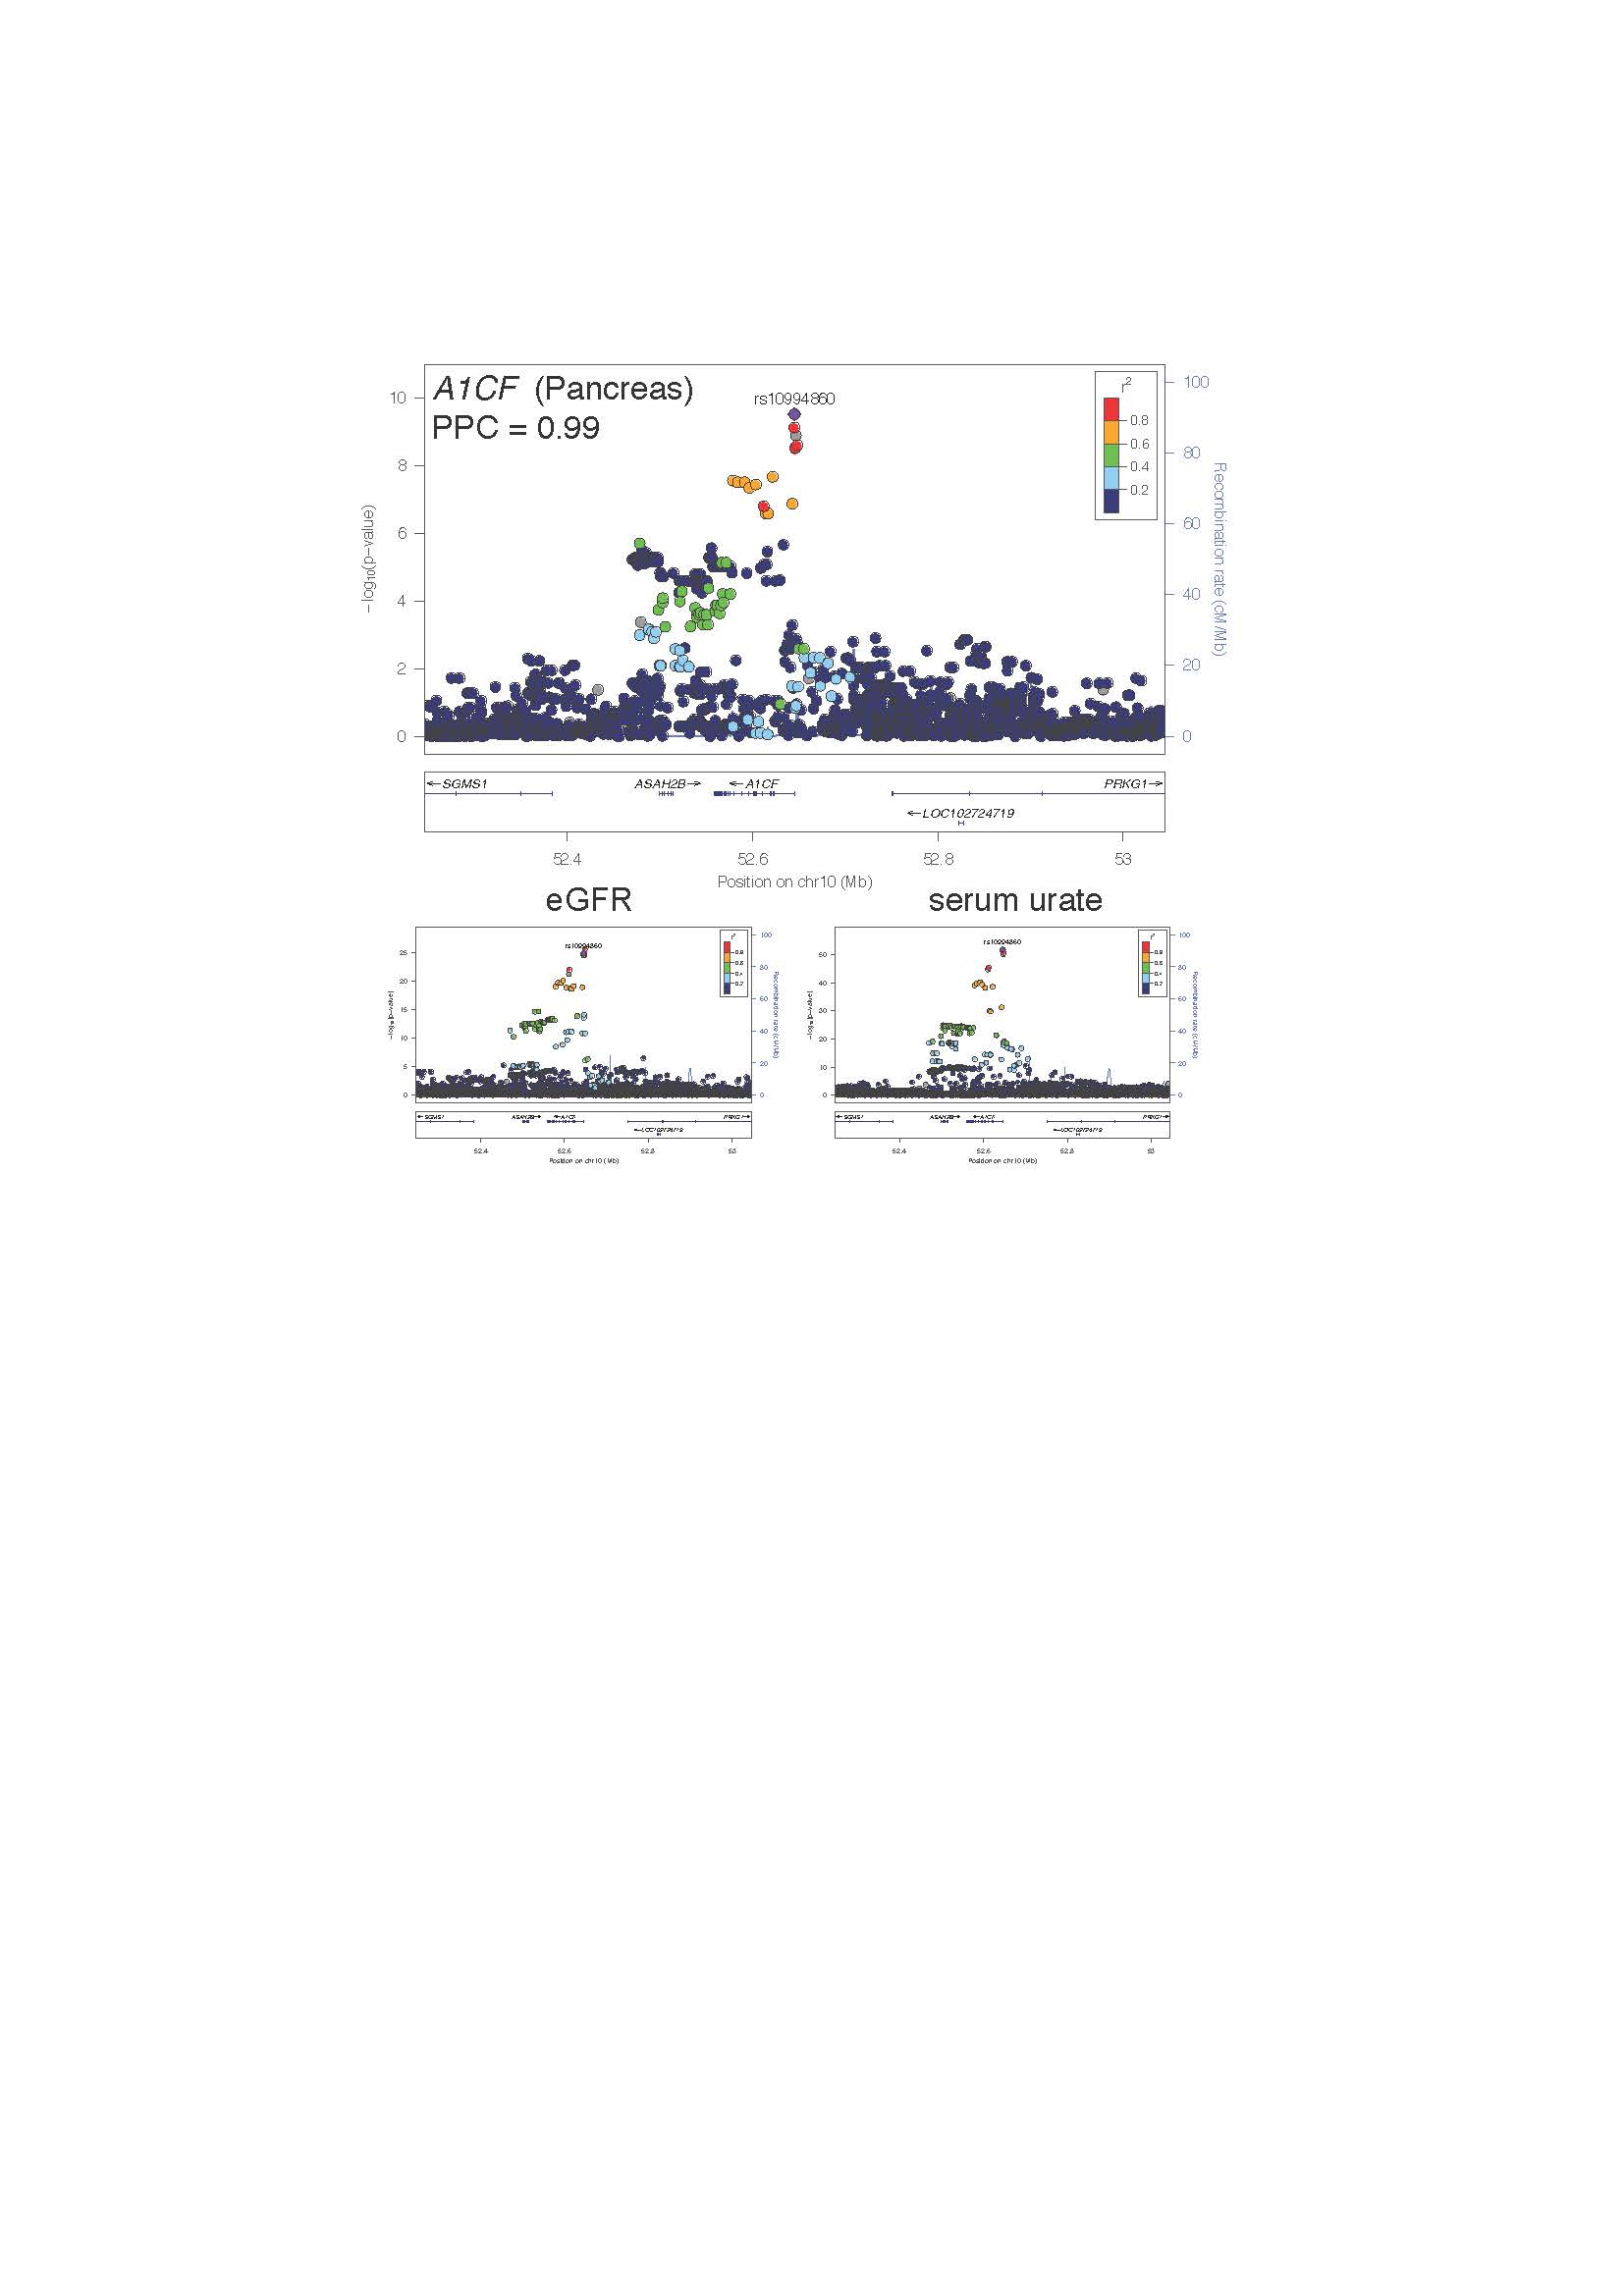
Results: The cohort was 53.7% female with an average age of 56.9 ± 8.0 years old. The average (SD) for eGFR was 112.8 ± 39.4 ml/min/1.73 m2, and the average (SD) for SU was 4.1 ± 1.1 mg/dL. Out of 511,828 genomic windows, 268 produced genetic covariance estimates between eGFR/ SU with 95% confidence intervals which did not overlap zero (Figure 1). Seven of the 15 largest magnitude covariance estimates validate shared loci from the marginal GWAS of eGFR/SU with the remainder representing novel shared eGFR/SU loci (Table 1). Sixteen shared eGFR/SU loci also colocalized with gene expression (posterior probability of colocalization (PPC) > 0.8). At the A1CF locus the eGFR/SU associations colocalize (PPC = 0.99) with an eQTL for A1CF (Figure 2). Furthermore, eQTL for FGF5 in kidney cortex, CD86 in whole blood and two transporter genes SLC15A2 and SLC7A9 were also identified.
Conclusion: Using our novel approach allowing direct estimates of the genetic covariance of eGFR/SU in specific windows of the genome, we demonstrate a set of loci contributing to the association between SU and eGFR. Many shared genomic regions also associate with gene expression thereby highlighting their potential functional significance. The extensive genetic signal shared between eGFR/SU suggests that pleiotropy, acting through gene expression differences, contributes to the genetic basis of the association between gout/HU and CKD.
 Table 1. List of 15 genomic windows with largest magnitude significant genetic covariance estimates. Chr column defines chromosome. Window size column contains # SNP markers/ window followed by its width [starting base pair position – ending base pair position]. Novel is defined as a locus that has not previously been implicated as a shared locus for eGFR/SU.
 Figure 1. Covariance estimates of LD windows in the UK Biobank. Windows that contained SNPs in genes associated with known eGFR genes are highlighted in dark green, windows that contained SNPs in genes associated with serum urate are highlighted in blue, and windows that contained SNPs in genes associated with both serum urate and eGFR (from comparing separate GWAS, Johnson et al.5) are highlighted in lime green. Windows with confidence limits not overlapping zero are highlighted in red.
 Figure 2. Regional association plots at the A1CF locus for an A1CF eQTL in pancreas (above) and corresponding urate and eGFR associations (below). The color of the surrounding SNPs indicates the strength of LD with the lead A1CF eQTL SNP (in purple) according to the key in the left top hand corner, measured as r2 found in the European HapMap data (hg19/1000 genomes Nov 2014). The plots were generated using LocusZoom.
To cite this abstract in AMA style:
Sumpter N, Lupi A, Leask M, Merriman T, Vazquez A, Reynolds R. Genomic Regions Jointly Associated with eGFR and Serum Urate: Implications for Shared Genetic Etiology of Hyperuricemia and Chronic Kidney Disease [abstract]. Arthritis Rheumatol. 2020; 72 (suppl 10). https://acrabstracts.org/abstract/genomic-regions-jointly-associated-with-egfr-and-serum-urate-implications-for-shared-genetic-etiology-of-hyperuricemia-and-chronic-kidney-disease/. Accessed .« Back to ACR Convergence 2020
ACR Meeting Abstracts - https://acrabstracts.org/abstract/genomic-regions-jointly-associated-with-egfr-and-serum-urate-implications-for-shared-genetic-etiology-of-hyperuricemia-and-chronic-kidney-disease/
