
Session Information
Date: Monday, November 18, 2024
Title: Osteoporosis & Metabolic Bone Disease – Basic & Clinical Science Poster
Session Type: Poster Session C
Session Time: 10:30AM-12:30PM
Background/Purpose: Osteoporosis, defined by the WHO as a BMD reduction of 2.5 standard deviations below that of a young healthy adult, is a major public health concern, costing the NHS £4.4 billion annually. Current DEXA screening primarily targets the femoral neck and lumbar spine, requiring outpatient appointments. This limits patient access and timely diagnosis, particularly for individuals with severe obesity, hyperparathyroidism, or those who have undergone hip replacements. Consequently, distal radius (DR) scans are often only used for patients with rheumatoid arthritis or hyperparathyroidism. This study aims to evaluate the correlation of BMD at the distal radius (DR) with the femoral neck and lumbar spine to determine the utility of DR scans in osteoporosis diagnosis.
Methods: Data from patients referred for DEXA scans between 2004 and 2024 in northwest England were analysed. Inclusion criteria required DEXA scans at the DR, lumbar spine, and bilateral femoral regions, this was performed in patients with rheumatoid arthritis, and hyperparathyroidism.. Stata(tm) version 18 was used for the analysis. Pearson correlation coefficients and linear regression models adjusted for BMI, age, gender were fitted.
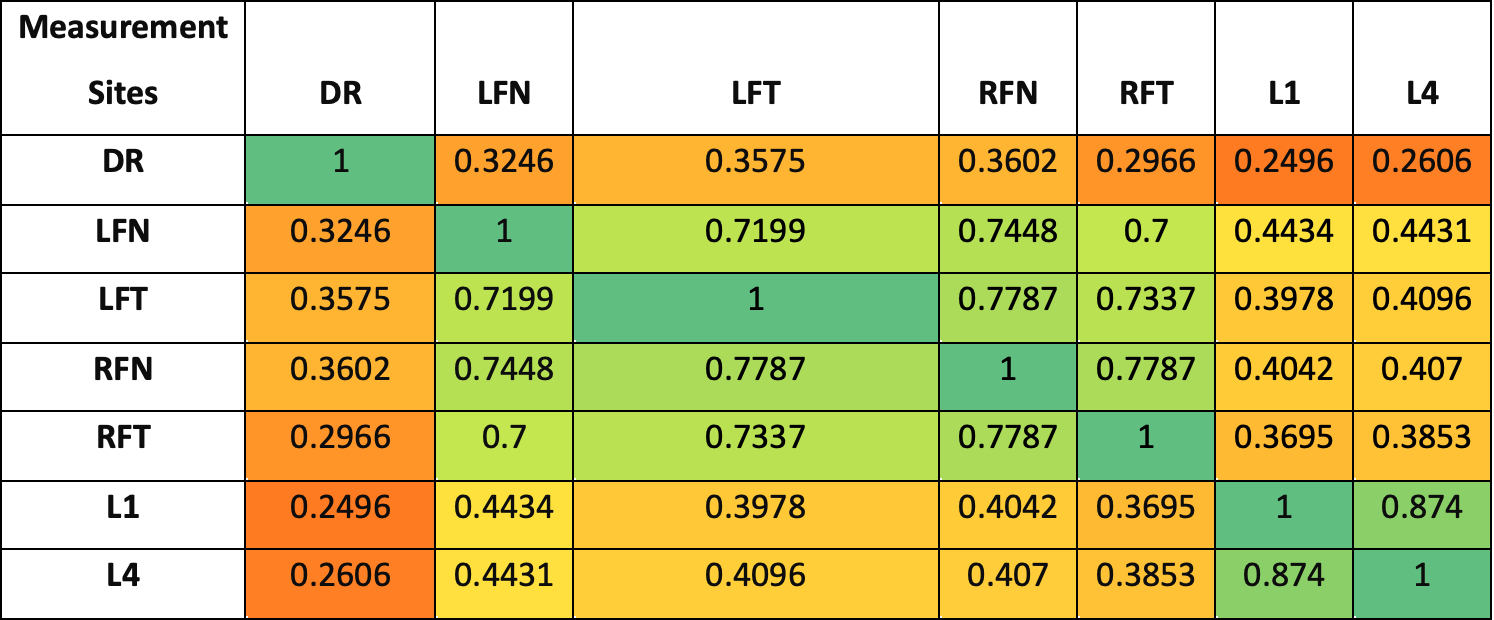
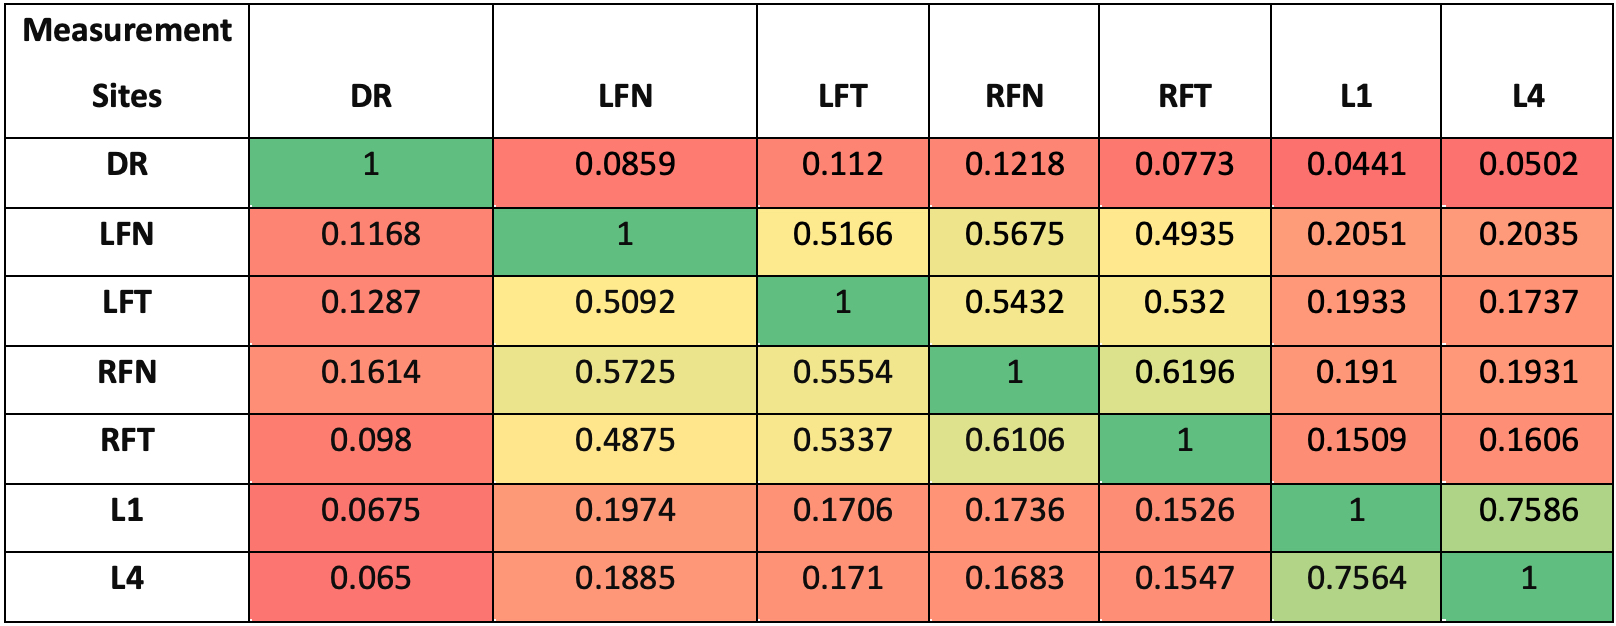
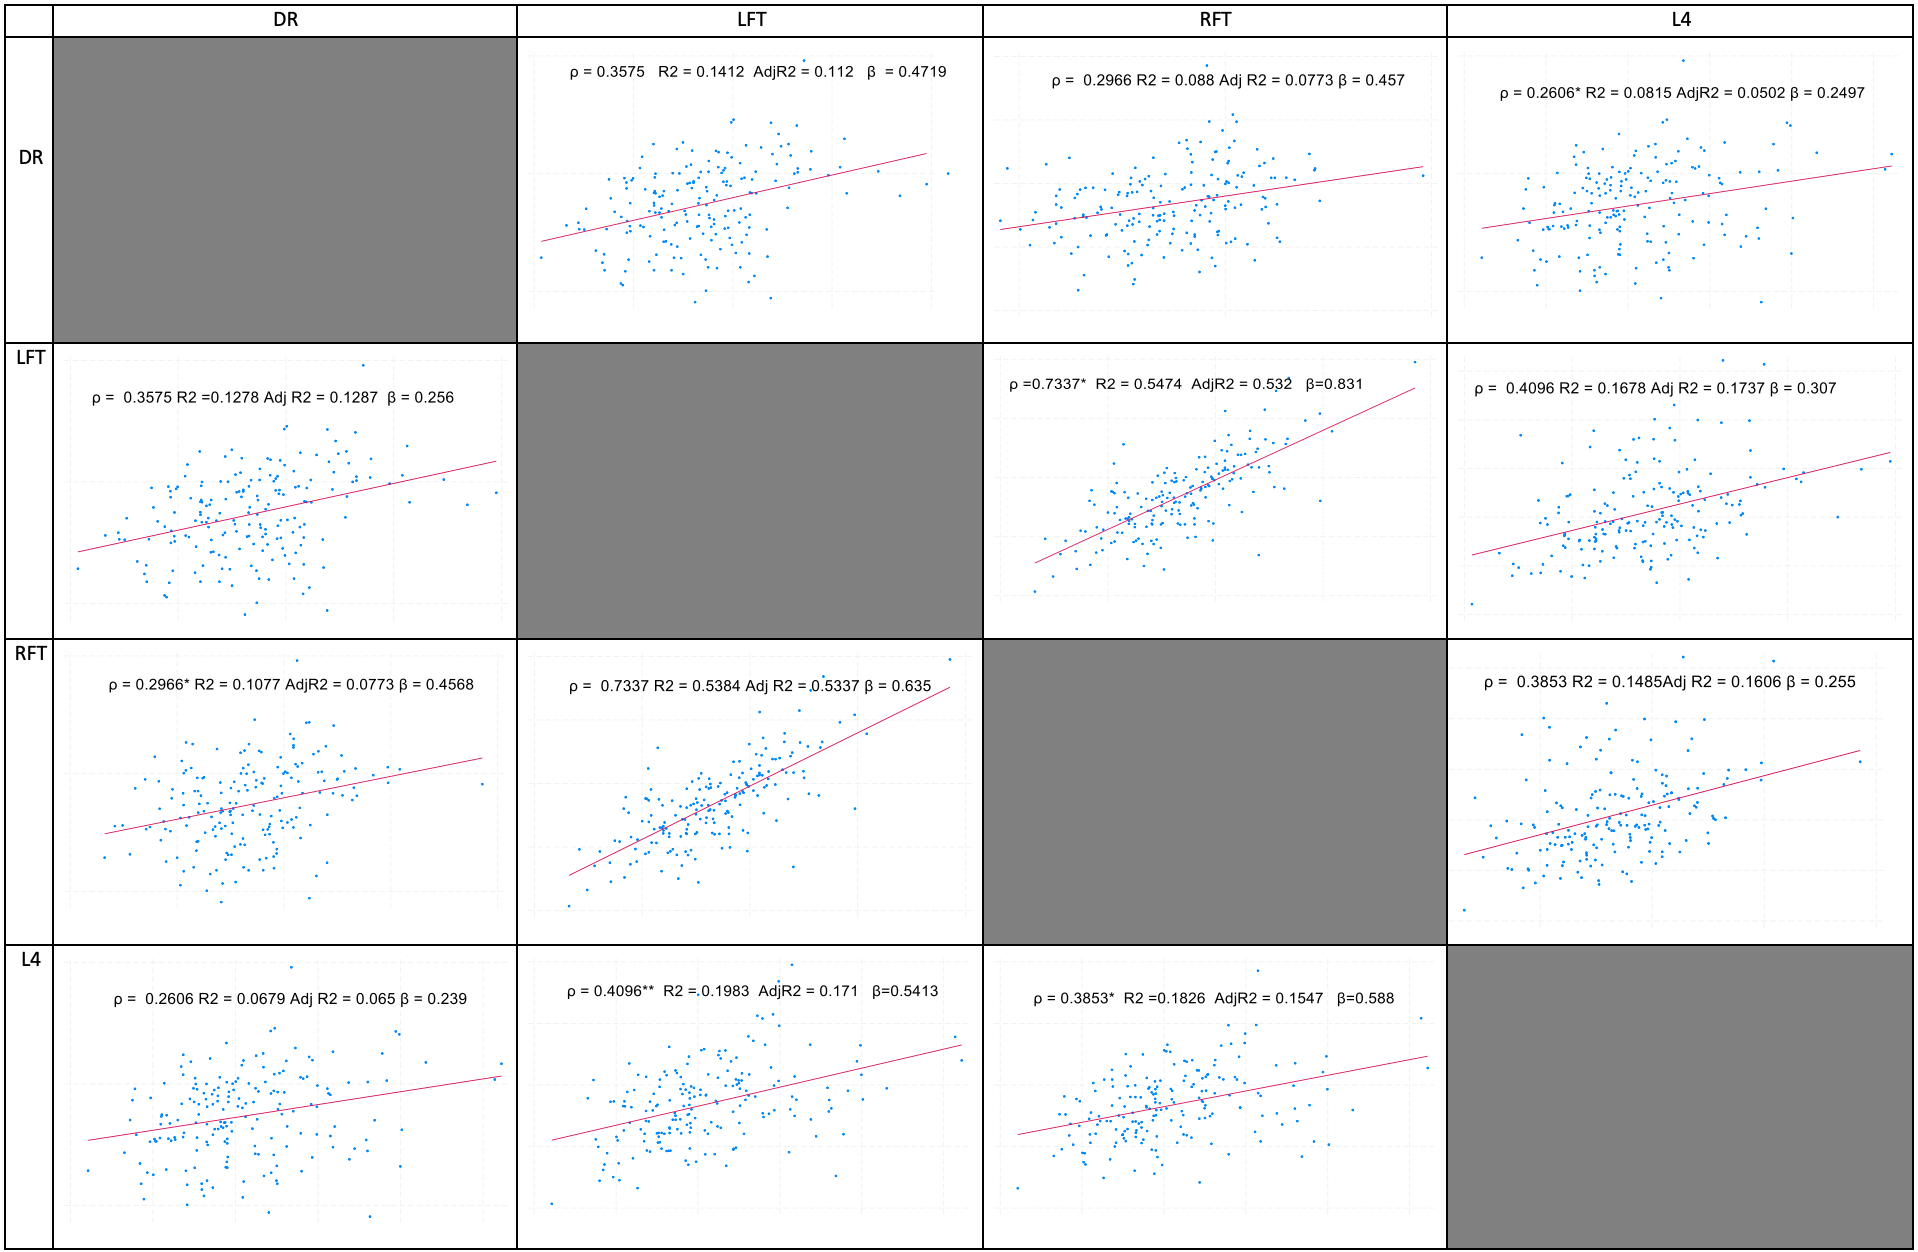
Results: 183 patients were included . The mean T-score at the DR in females was -1.37, significantly lower than at other sites. Correlation analysis revealed a weak association between the DR and lumbar spine (ρ=0.2496) but stronger correlations with femoral sites, especially the right femur neck (RFN) with ρ=0.3602. Unadjusted regression models showed an R² of 0.1297 between the DR and RFN, compared to 0.0623 for the lumbar spine. Adjusted models reinforced these findings, with the DR showing stronger predictive power for femoral BMD changes.
Conclusion: Distal radius measurements show significant potential for osteoporosis screening and diagnosis, especially when femoral scans are not feasible. Our results indicate that DR measurements correlate well with femoral BMD, particularly at the femoral neck, and could be effectively used in osteoporosis diagnosis when femoral scans are impractical. While some of our findings differ from previous research, such as Han et al. (2013) and Pu et al. (2022), who reported stronger correlations between forearm and lumbar spine BMD, our study emphasizes the robustness of DR as a predictor for femoral BMD. These findings are promising and highlight the potential for DR measurements to enhance osteoporosis screening, leading to earlier detection and improved patient outcomes. The observed differences also open avenues for further research to explore and clarify these relationships. Despite some limitations, including sample size and potential confounding factors, our study provides a strong foundation for the clinical use of DR measurements. This approach could improve osteoporosis detection, reduce fractures, and enhance patient care. Further research is needed to optimize the clinical use of DR measurements.
To cite this abstract in AMA style:
Lafi M, Amin H, Khan M, Bukhari M. Distal Radius Correlation with Femur and Lumbar Spine T-scores: A Comprehensive Analysis [abstract]. Arthritis Rheumatol. 2024; 76 (suppl 9). https://acrabstracts.org/abstract/distal-radius-correlation-with-femur-and-lumbar-spine-t-scores-a-comprehensive-analysis/. Accessed .« Back to ACR Convergence 2024
ACR Meeting Abstracts - https://acrabstracts.org/abstract/distal-radius-correlation-with-femur-and-lumbar-spine-t-scores-a-comprehensive-analysis/