Session Information
Session Type: Poster Session C
Session Time: 9:00AM-11:00AM
Background/Purpose: Cartilage loss in 1-2 year osteoarthritis clinical trials is often small, but a critical outcome measure. The aim of this study was to compare the cross-sectional relationship and longitudinal responsiveness of the semi-quantitative MRI Osteoarthritis Knee Score (MOAKS) with quantitative cartilage thickness measures.
Methods: Images and MOAKS scores from 297 participants with radiographic progression (groups 1 and 2) from the OAI FNIH sub-cohort were included. To facilitate direct comparison with MOAKS, novel quantitative measures of cartilage loss were matched to MOAKS regions (Q-MOAKS).Mean normative cartilage thickness was computed for each subregion (Figure 1) using FNIH controls (group 4). Q-MOAKS thickness loss score (tQCM) was based on the proportion of cartilage thickness over a subregion that was < 95% normative thickness and denudation score (dQCM) was based on < 5% normative thickness. Q-MOAKS area proportions (tQCMr) were compared for responsiveness. These were categorised into scores as for MOAKS for cross-sectional analysis. Quantitative cartilage thickness (ThCtAB) was also measured in the MOAKS subregions. We compared MOAKS against Q-MOAKS and ThCtAB. Cross-sectional relationships between measures were assessed using Spearman’s rank correlation. Responsiveness was assessed at 1 and 2 years using standardised response means (SRM).
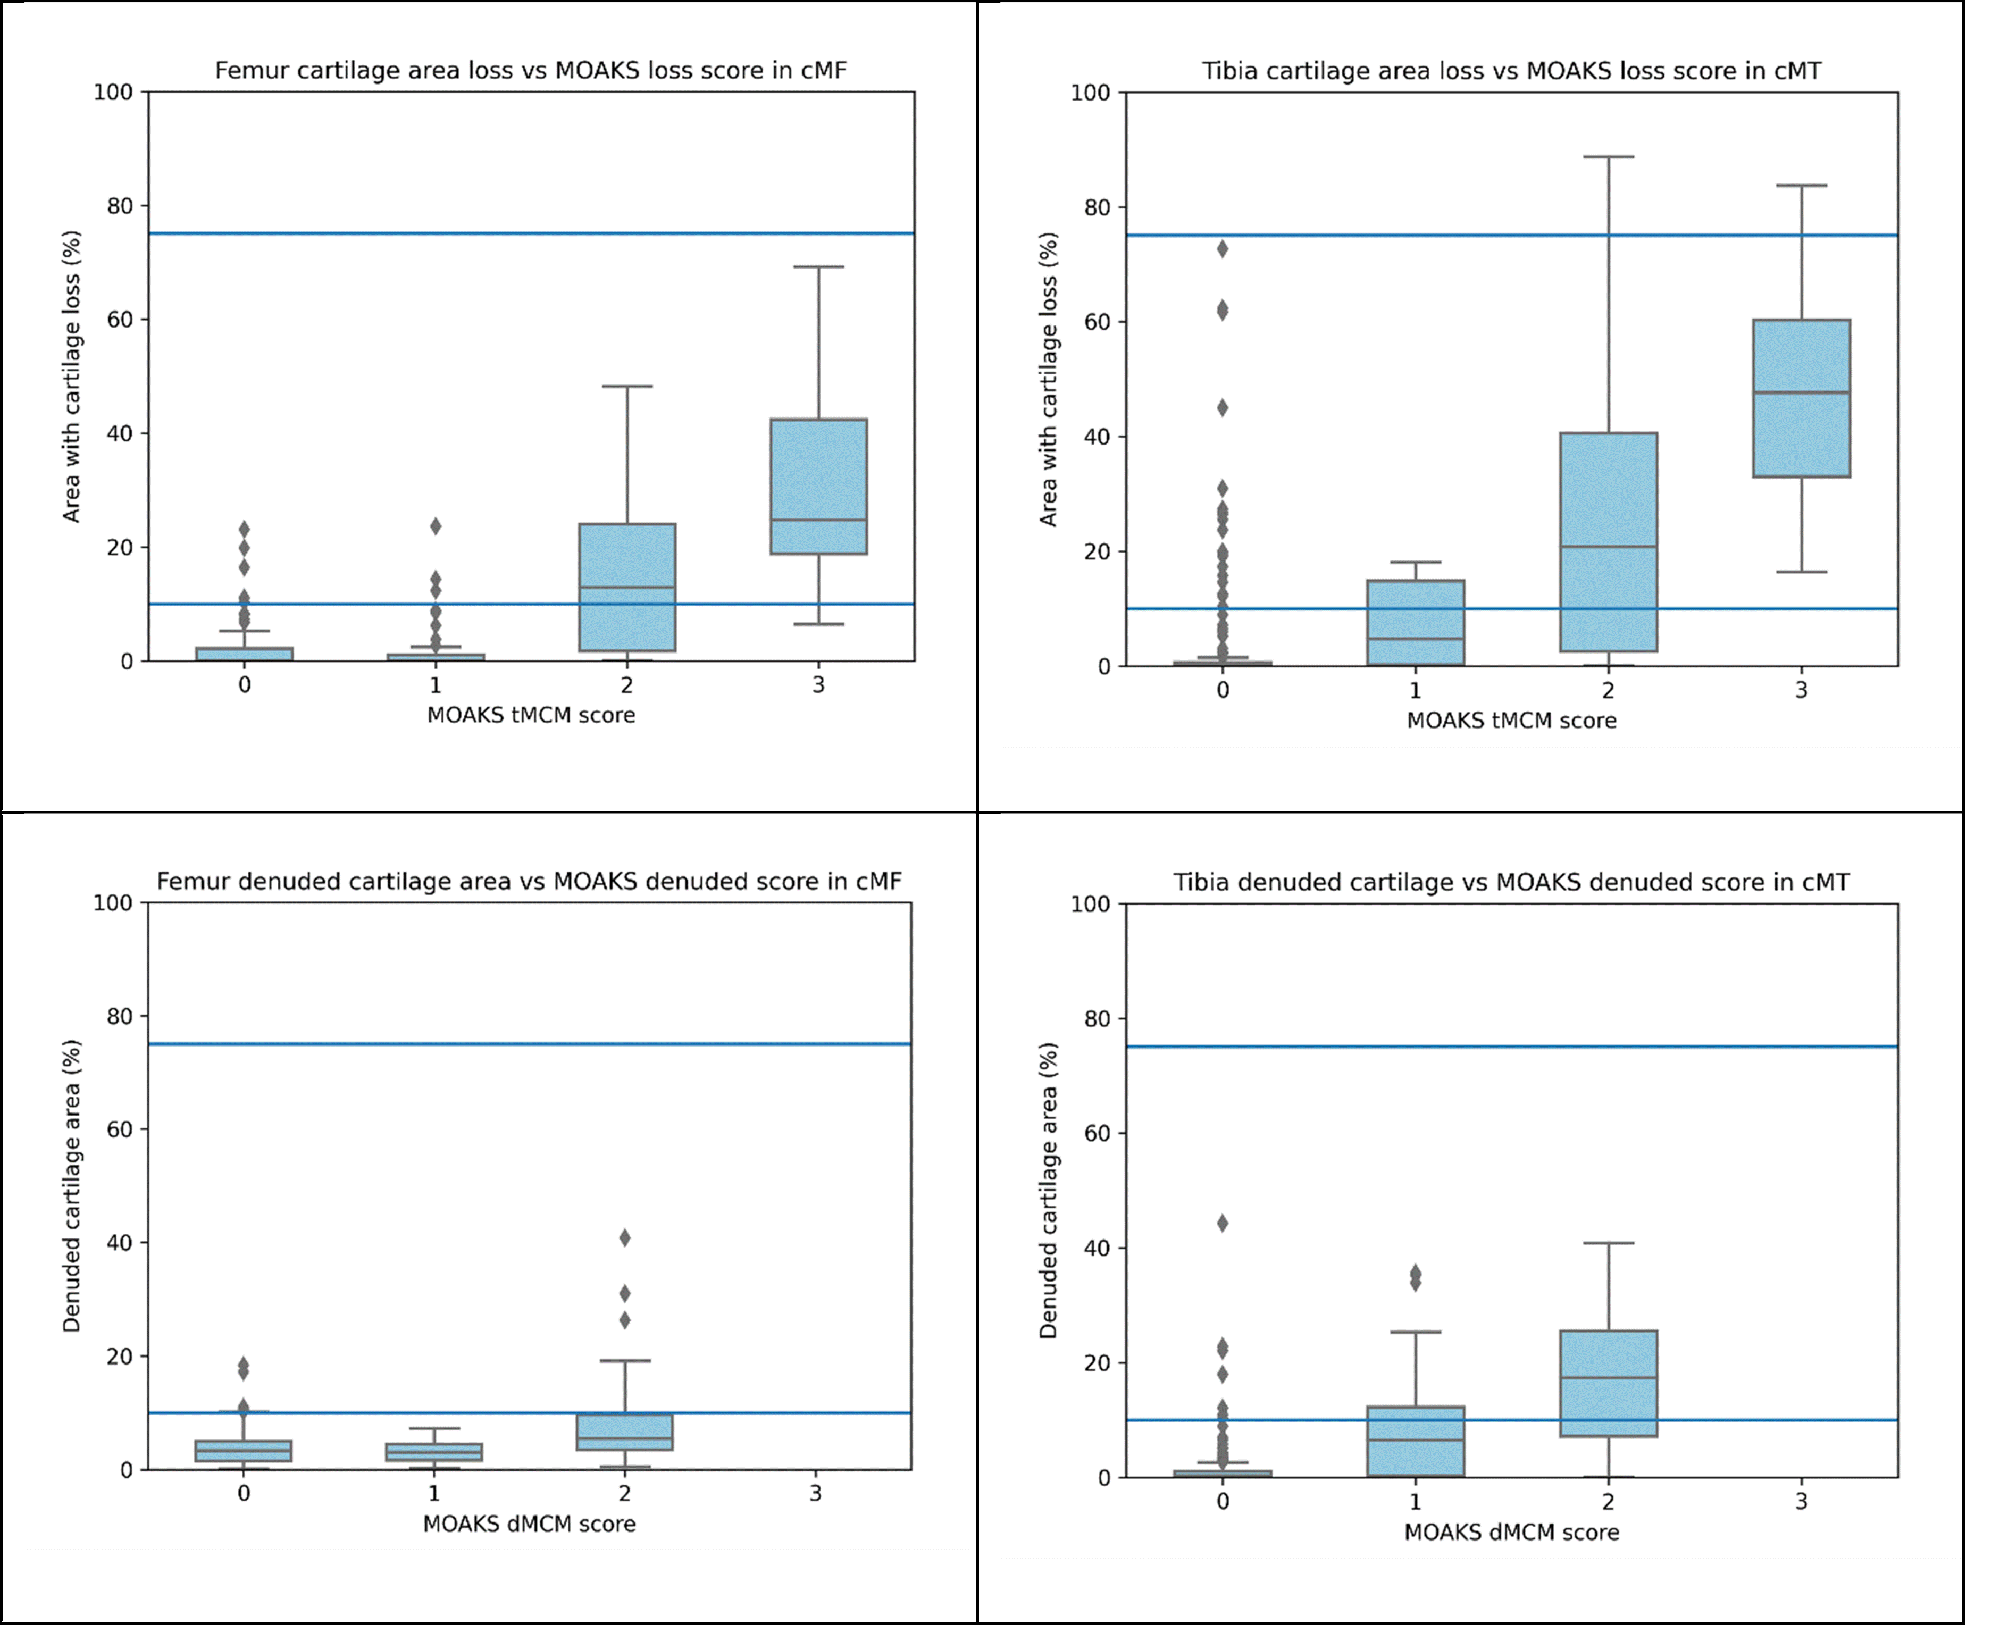
Results: Cross-sectionally, there was moderate correlation between MOAKS and Q-MOAKS denudation in the central medial femur (cMF r=0.42, (95%CI:0.32, 0.51)) and tibia (cMT r=0.51, (0.42, 0.59)). There was a poor correlation between MOAKS and Q-MOAKS thickness loss and denudation scores in all other regions. In the cMT region, 61% (96/159) of knees with MOAKS thickness loss tMCM = 2 (the 10-75% score) were also tQMC = 2 and 66% of MOAKS denudation dMCM = 2 were also dQCM = 2 (Figure 2). In the cMF region, the figures were 56% and 23%.MOAKS tMCM and dMCM were less responsive than Q-MOAKS tQCM and dQCM in most subregions (Table 1). MOAKS tMCM in cMT demonstrated the most responsiveness for all the thickness loss scores (SRM=0.47, (95%CI:0.41, 0.54)). Quantitative cartilage thickness (ThCtAB) measures were most responsive.
Conclusion: In the cross-sectional analysis, the concordance between MOAKS scores and the actual ratio of cartilage loss to subregion area was poor. MOAKS appeared to overestimate grades 2 and 3. Quantitative measures of thickness loss were almost twice as responsive as MOAKS, likely because thickness loss is a more responsive construct than area loss for cartilage assessment.
To cite this abstract in AMA style:
Ray A, Brett A, Dube B, Bowes M, Conaghan P. Cartilage Thickness Measures Are More Responsive Than Cartilage Area Loss Measures: A Comparison of Quantitative and Semi-quantitative Cartilage Assessments from the Osteoarthritis Initiative [abstract]. Arthritis Rheumatol. 2023; 75 (suppl 9). https://acrabstracts.org/abstract/cartilage-thickness-measures-are-more-responsive-than-cartilage-area-loss-measures-a-comparison-of-quantitative-and-semi-quantitative-cartilage-assessments-from-the-osteoarthritis-initiative/. Accessed .« Back to ACR Convergence 2023
ACR Meeting Abstracts - https://acrabstracts.org/abstract/cartilage-thickness-measures-are-more-responsive-than-cartilage-area-loss-measures-a-comparison-of-quantitative-and-semi-quantitative-cartilage-assessments-from-the-osteoarthritis-initiative/


