Session Information
Date: Sunday, November 8, 2020
Title: Epidemiology & Public Health Poster III: Inflammatory Rheumatic Disease
Session Type: Poster Session C
Session Time: 9:00AM-11:00AM
Background/Purpose: The hospitalization rate for gout has been increasing in recent years with a reduction in people with RA. To our knowledge, there are no studies of time-trends in U.S. national estimates of cardiac versus orthopedic procedures in people with gout compared to RA. Our study objective was to compare time-trends in cardiac versus orthopedic procedures in people with gout versus RA. We hypothesized that (1) RA would be associated with higher annual volume and rates of both procedures at the beginning and the end of our study period, but the gout-RA gap will narrow over time, (2) increase in the annual volume of orthopedic procedures will be higher than cardiac procedures in both, and (3) increase in their annual volume in gout or RA will outpace that in the general U.S. population.
Methods: We examined the frequency of 7 common cardiac and orthopedic procedures in hospitalized people with gout or RA (or the general population) using the 1998-2014 U.S. National Inpatient Sample (NIS). Poisson regression evaluated the statistical significance of the differences in frequencies in 1998 versus 2014, between gout and RA, and within each cohort.
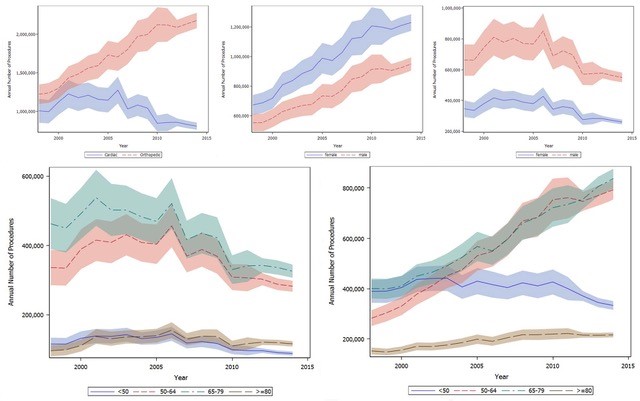
Results: The rate of cardiac procedures per 100,000 NIS claims decreased from 2,977 in 1998 to 2,292 in 2014; the rate of orthopedic procedures increased from 3,609 in 1998 to 6,160 in 2014 in the U.S. general population (Figure 1).
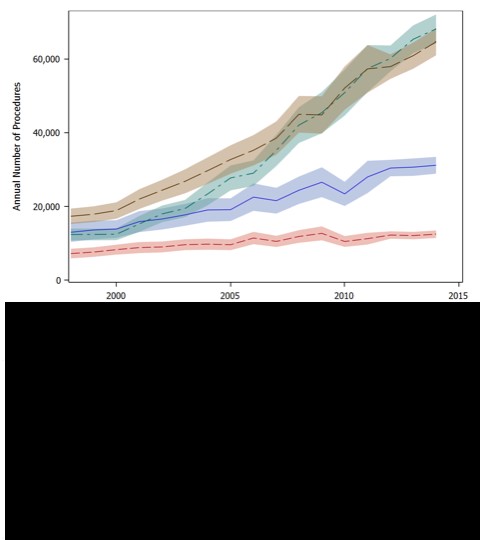
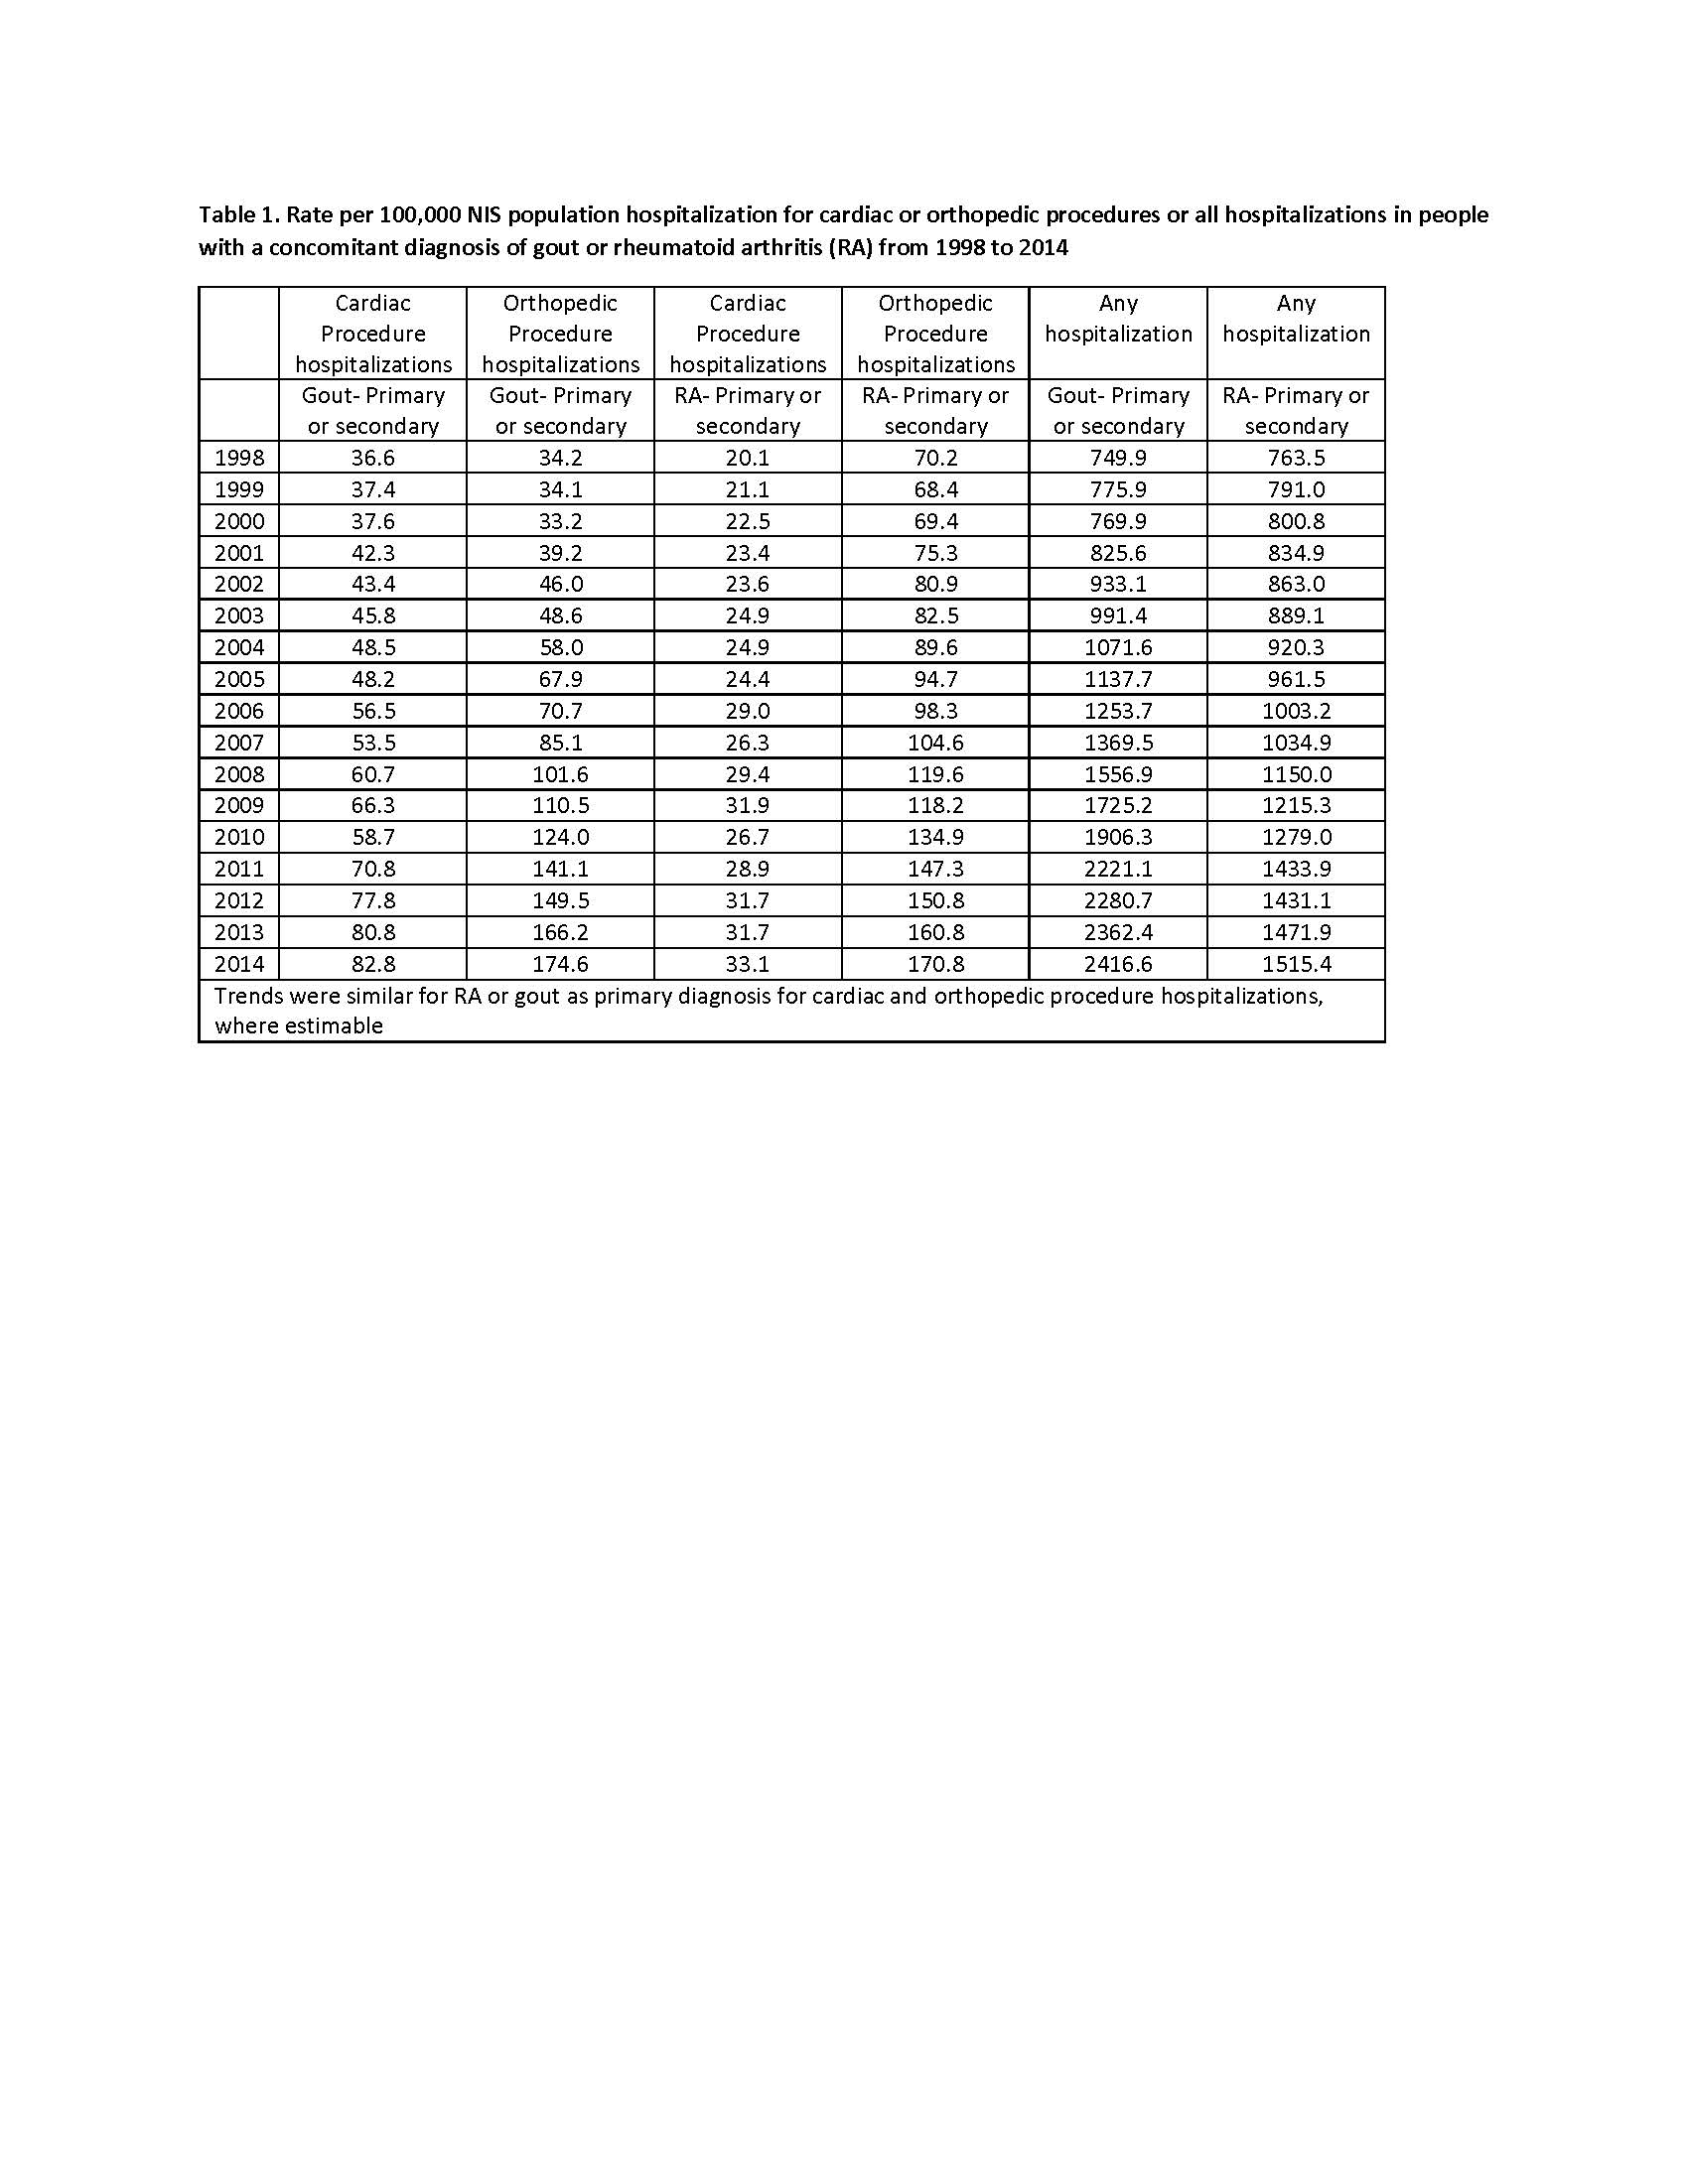
Both in-hospital cardiac and orthopedic procedures increased in gout and RA with time, in contrast to declining numbers in the general U.S. population; orthopedic procedures became more common than cardiac procedures in gout and RA. The corresponding increase in in-hospital cardiac and orthopedic procedure rates per 100,000 NIS claims in two populations were as follows: (1) gout, 2.3 (36.6 to 82.8) and 5.1-fold (34.2 to 174.6); and (2) RA, 1.6 (20.1 to 33.1) and 2.4-fold (70.2 to 170.8), respectively (Figure 2). In RA, the cardiac-orthopedic procedure volume difference was significant in 1998 and 2014. We noted no significant difference between cardiac versus orthopedic procedures in 1998 in gout, but the difference was significant in 2014. Cardiac procedures were significantly higher in gout versus RA in 1998 (59% higher) and 2014 (92% higher; Figure 2).
The orthopedic procedures in gout were significantly lower than RA in 1998 (33% lower), but were significantly higher than RA in 2014 (5% higher; Figure 2). Of all hospitalizations with cardiac/orthopedic procedures, the proportion of people with each as primary or secondary diagnosis increased from 1998 to 2014: (1) in-hospital cardiac procedures: 1.2% to 3.6% with gout; 0.7% to 1.4% with RA; and (2) in-hospital orthopedic procedures: 0.9% to 2.8% with gout; 1.9% to 2.8% with RA
Conclusion: Cardiac and orthopedic procedures increased in gout and RA 1998-2014 versus decline in the general population. Cardiac procedure volumes and rates were higher in gout versus RA in 1998 and 2014. Increasing in-hospital cardiac procedures in gout and RA contrasting with declining rates in the general U.S. population indicated that early diagnosis of gout and RA, and management of systemic inflammation are needed. Orthopedic procedures were more in 1998, but fewer in 2014 in RA versus gout.
 Figure 1. Time-trends in cardiac and orthopedic procedures in the U.S. general population during the study period 1998-2014 showing the overall trend (A), cardiac procedures by sex (B), orthopedic procedures by sex (C), cardiac procedures by age groups (D) and orthopedic procedures by age groups (E) Figure 1 legend: X-axis represents the study year and Y-axis shows the number of annual procedures. Estimates over time are shown with the line and the shaded area represents the upper and lower 95% confidence intervals. The Y-axis scales differs between panels.
 Figure 2. Time-trends in cardiac and orthopedic procedures from 1998-2014 in people with gout or rheumatoid arthritis (RA) during the study period showing the overall trends Figure 2 legend: X-axis represents the study year and Y-axis shows the number of annual procedures. Estimates over time are shown with the line and the shaded area represents the upper and lower 95% confidence intervals. The Y-axis scales differs between panels.
 Table 1. Rate per 100,000 NIS population hospitalization for cardiac or orthopedic procedures or all hospitalizations in people with a concomitant diagnosis of gout or rheumatoid arthritis (RA) from 1998 to 2014
To cite this abstract in AMA style:
Singh J, Cleveland J. Annual Cardiac or Orthopedic Procedure Volume in Gout versus Rheumatoid Arthritis: A National Time-trends Study [abstract]. Arthritis Rheumatol. 2020; 72 (suppl 10). https://acrabstracts.org/abstract/annual-cardiac-or-orthopedic-procedure-volume-in-gout-versus-rheumatoid-arthritis-a-national-time-trends-study/. Accessed .« Back to ACR Convergence 2020
ACR Meeting Abstracts - https://acrabstracts.org/abstract/annual-cardiac-or-orthopedic-procedure-volume-in-gout-versus-rheumatoid-arthritis-a-national-time-trends-study/
