Session Information
Session Type: Poster Session A
Session Time: 9:00AM-11:00AM
Background/Purpose: We developed an electronic health record (EHR)-based patient-facing sidecar dashboard application to display RA outcomes, including disease activity, functional status, and pain scores over time (“RA dashboard”). User log data is a novel data source that makes it possible to examine provider engagement with technology. We analyzed user log data from the RA dashboard to examine patterns of provider engagement with this health-information technology (IT) tool in the context of a pragmatic clinical trial.
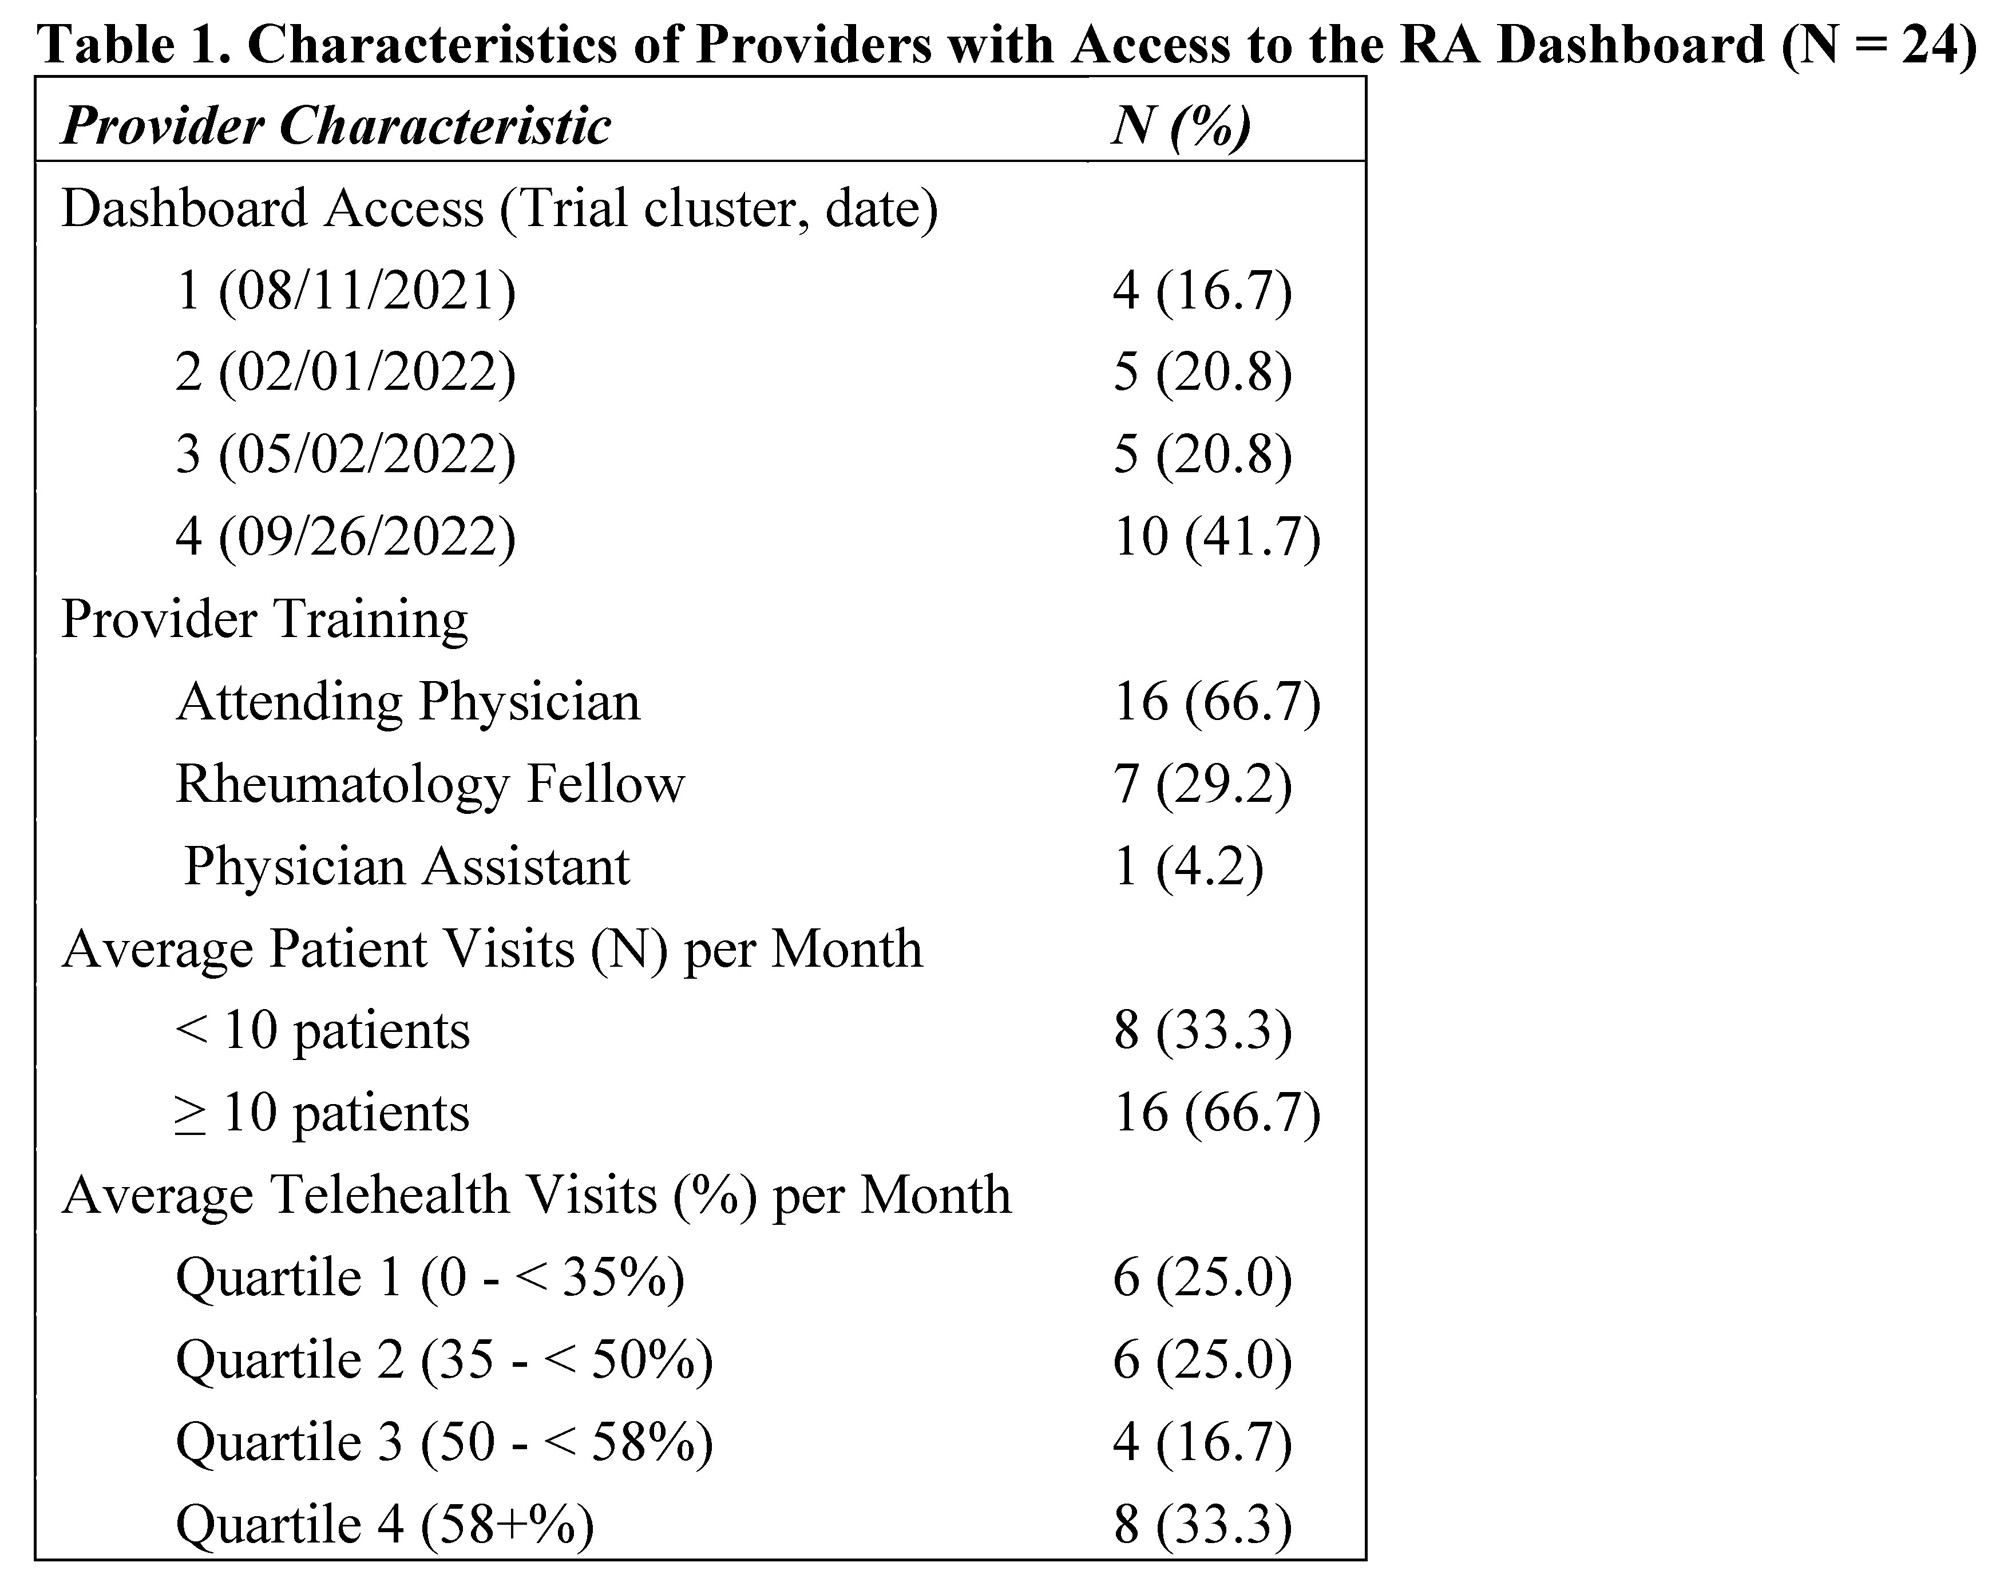
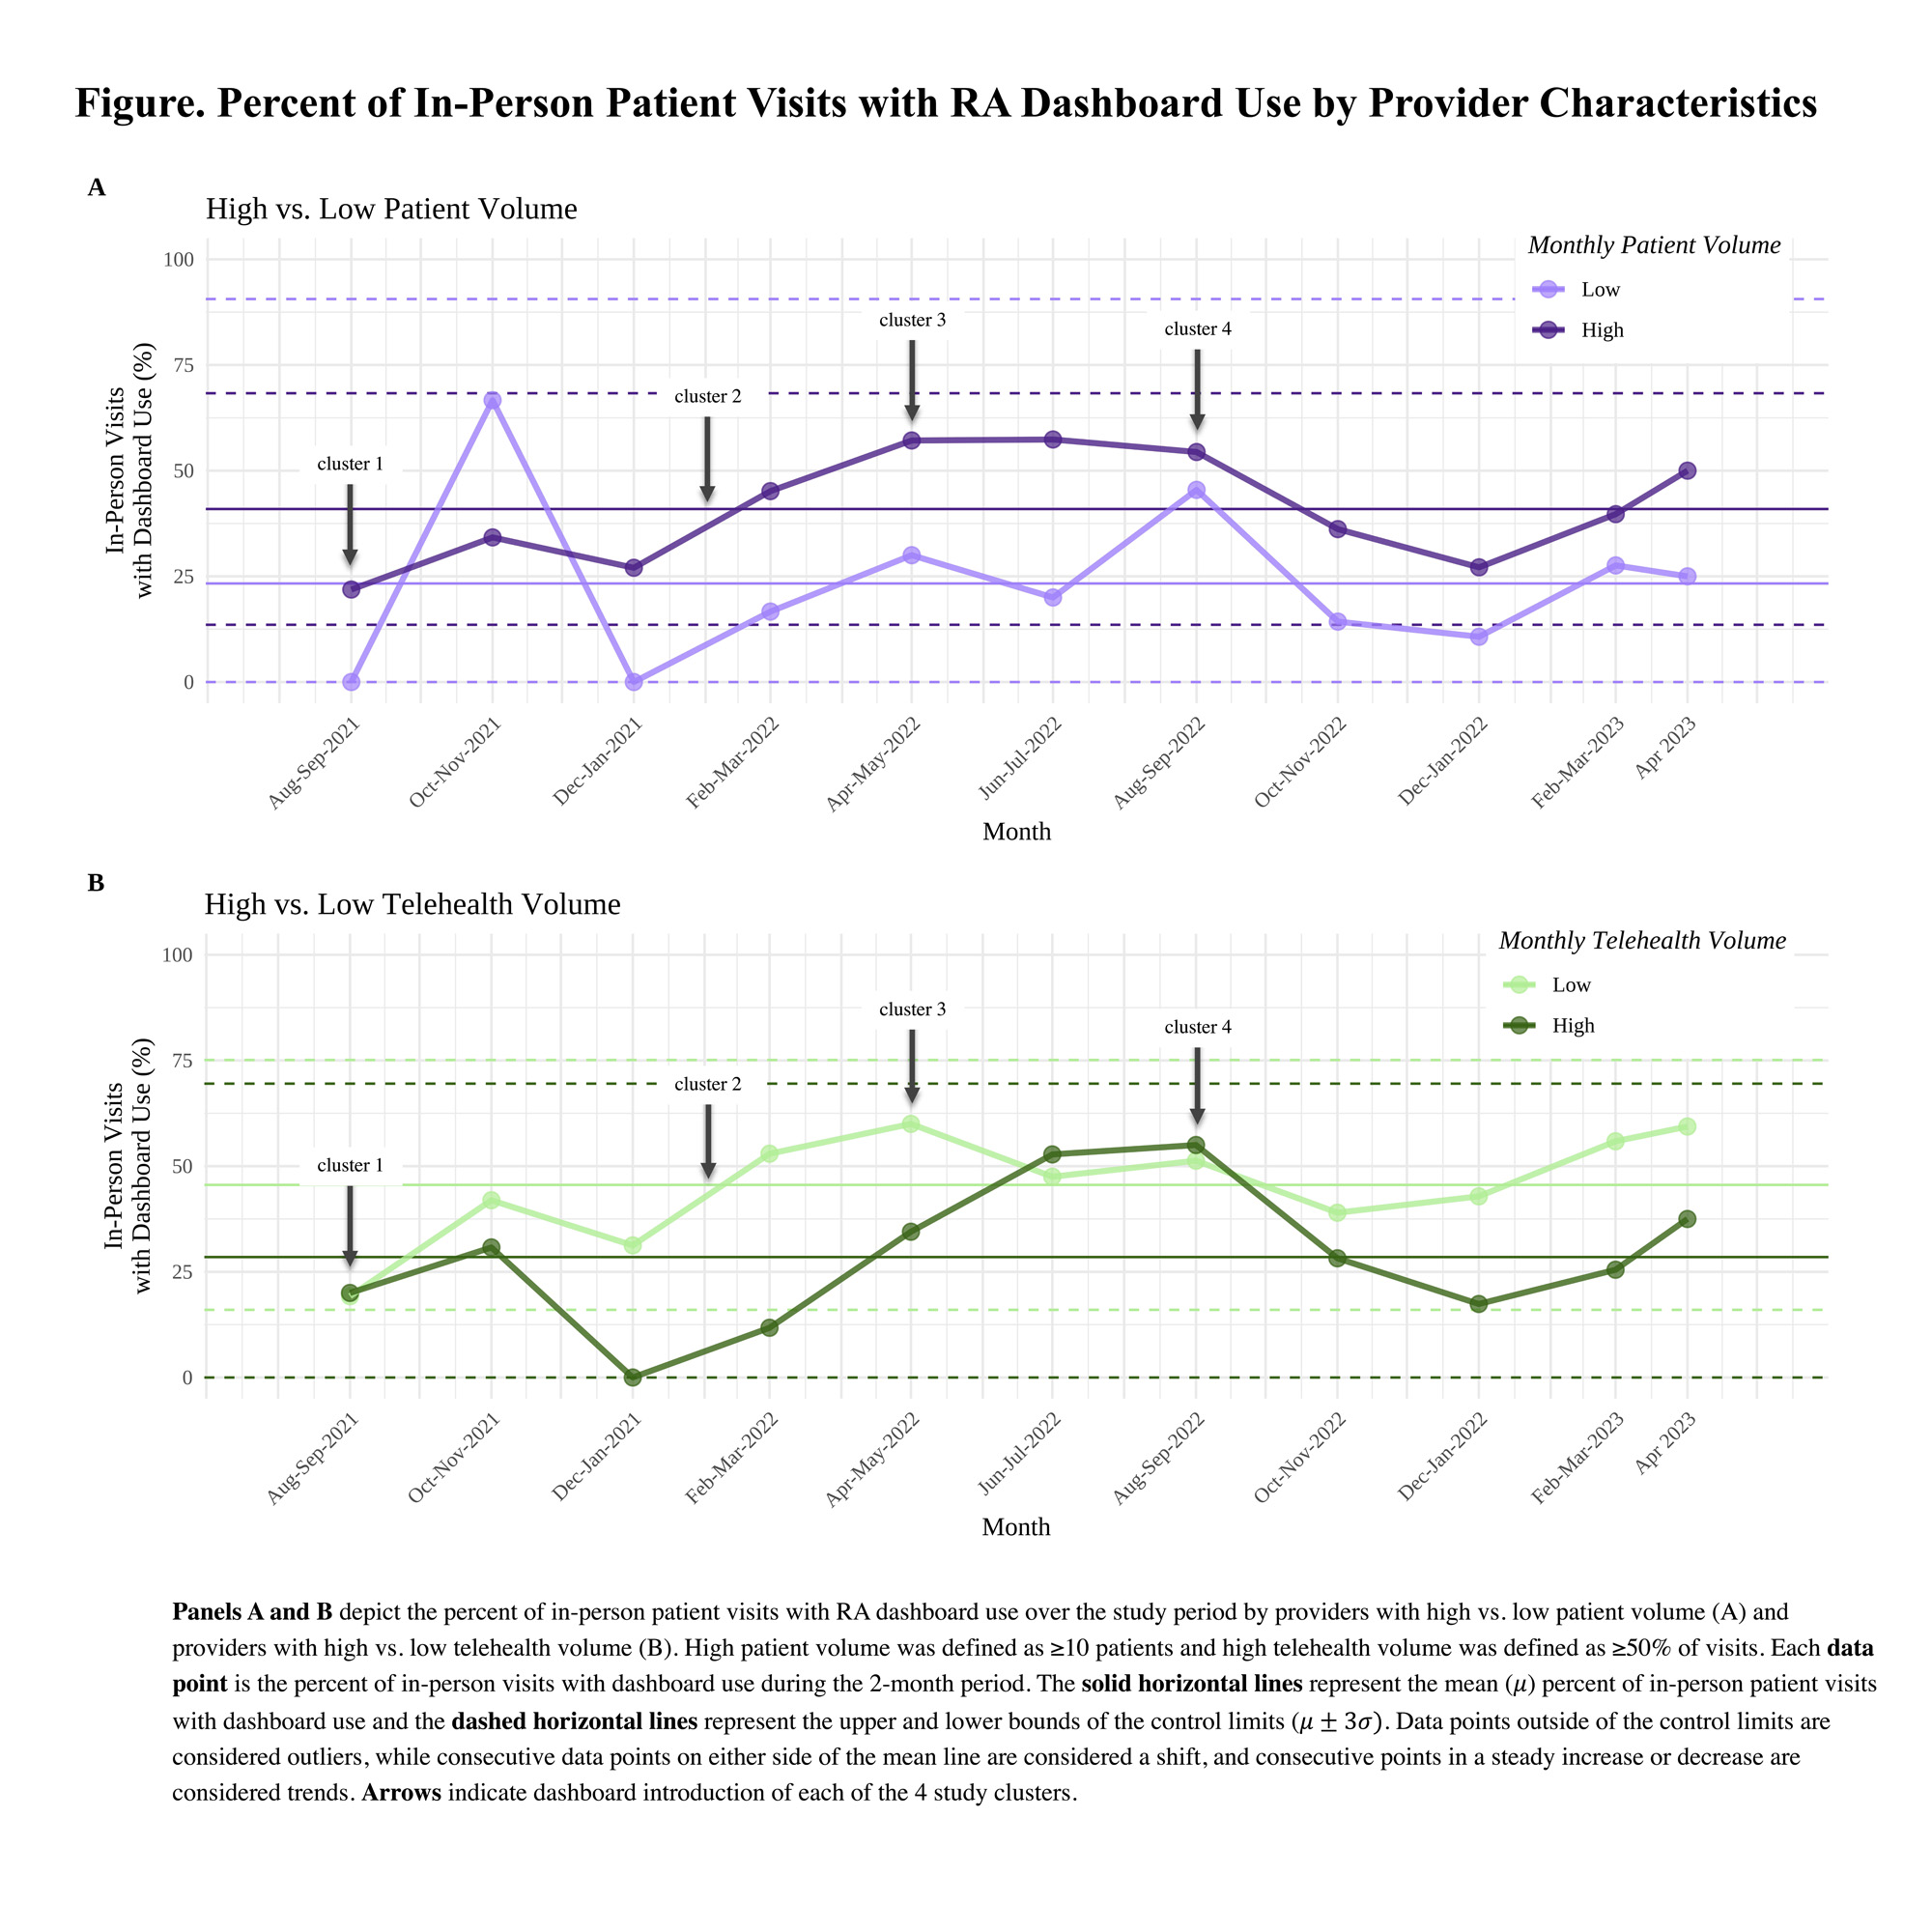
Methods: The RA dashboard was implemented at a single academic rheumatology clinic as part of a stepped-wedge pragmatic trial in which 24 providers were randomized into 4 trial clusters between August 2021 and September 2022. User log data were collected from the initial roll-out through April 2023. The primary outcome was the number of “actions” taken by providers on the dashboard: possible actions included refresh, print, show/hide different sections of the dashboard, and scrolling up/down on the page or backward/forward through historical data. Provider characteristics included level of training, monthly patient volume (for patients with any diagnosis); percent of total visits that were completed via telehealth (video or telephone), and randomization cluster (Table). We examined engagement with the dashboard (proportion of visits with at least 1 action) overall, over time, and by provider characteristics using proportions and statistical control charts.
Results: Most providers were attendings with ≥ 10 patient visits per month; 50% of providers performed more than half of their visits via telehealth (Table). In total, 2,066 RA visits occurred after the dashboard was rolled out, 998 (48%) of which occurred in-person. Overall, the dashboard was used during 23% of RA patient visits, although this percentage was higher among in-person visits compared to telehealth visits (37% vs. 10%). Among in-person visits with any dashboard actions (N=372), there was a mean (SD) of 15.6 (20.5) actions of any kind. Refresh was the most common action (occurring in 81% of in-person visits with any actions), followed by scrolling up/down (67%) and show/hide (7%). Engagement with the dashboard was relatively stable over time (range 0-30% for all visits; 0-56% for in-person visits over the study period). Providers with ≥ 10 patient visits per month and providers who performed fewer visits via telehealth had more engagement compared to providers with lower patient volumes, and providers with more telehealth, respectively.
Conclusion: User log data is a feasible method to monitor provider engagement with a novel health IT tool in the context of a pragmatic trial. Overall engagement with the RA dashboard was low, although we observed more engagement for in-person visits and among providers with higher patient volumes. Trials of technology need to plan for high variability in provider engagement and consider strategies to include highly engaged providers in order to accurately measure the effect of technology on health outcomes.
To cite this abstract in AMA style:
Jacobsohn L, Kersey E, Li J, Nasrallah C, Wilson C, Young C, Young C, Hamblin A, Yazdany J, Schmajuk G. Analyzing User Log Data to Track Provider Use of an EHR-based Dashboard for Rheumatoid Arthritis Outcomes [abstract]. Arthritis Rheumatol. 2023; 75 (suppl 9). https://acrabstracts.org/abstract/analyzing-user-log-data-to-track-provider-use-of-an-ehr-based-dashboard-for-rheumatoid-arthritis-outcomes/. Accessed .« Back to ACR Convergence 2023
ACR Meeting Abstracts - https://acrabstracts.org/abstract/analyzing-user-log-data-to-track-provider-use-of-an-ehr-based-dashboard-for-rheumatoid-arthritis-outcomes/


