Session Information
Date: Sunday, November 17, 2024
Title: Abstracts: SLE – Diagnosis, Manifestations, & Outcomes II: Biomarkers
Session Type: Abstract Session
Session Time: 1:00PM-2:30PM
Background/Purpose: To evaluate the feasibility of using fibroblast activating protein inhibitor (FAPI) PET imaging as a molecular tracer and non-invasive tool for assessing renal tubulointerstitial fibrosis in patients with lupus nephritis.
Methods: The study included 29 patients with lupus nephritis who underwent 68Ga-FAPI PET/CT scanning to quantify 68Ga-FAPI uptake. Renal biopsies were performed within a week of scanning. Renal fibrosis levels in biopsy samples were assessed using Masson staining. Immunofluorescence analysis identified the expression of fibroblast activating protein (FAP), E-cadherin, alpha-smooth muscle actin (α-SMA) in the renal biopsy specimens. FAP expression at the mRNA level and its association with interferon levels were explored using microarray data from the Gene Expression Omnibus (GEO) database. Additionally, quantitative polymerase chain reaction (qPCR) and western blot analyses quantified FAP mRNA and protein expression in renal tubular epithelial cells (RTEC) following stimulation with interferon-alpha (IFN-α) in vitro.
Results: The study revealed significantly increased renal 68Ga-FAPI uptake in patients with lupus nephritis (n=29) compared to healthy controls (n=26). Standardized renal FAPI uptake positively correlated with disease duration, creatinine levels, chronic renal pathology scores, and renal tubulointerstitial fibrosis levels assessed by Masson staining. Patients with a chronic score exceeding 4, indicative of a poorer prognosis, showed markedly higher renal FAPI uptake. FAP expression was predominantly localized in RTEC, where increased FAP expression corresponded to reduced E-cadherin expression, indicating a loss of epithelial characteristics. Gene set enrichment analysis (GSEA) of GSE 112943 and GSE 60861 datasets showed positive enrichment of type I IFN signaling gene sets (P < 0.01). Correlation analysis of IFN-α and IFN-γ pathways with FAP expression in these datasets was significant (P < 0.01). In vitro experiments with IFN-α-stimulated RTEC showed elevated mRNA and protein expression of FAP, suggesting that interferon may induce FAP expression.
Conclusion: This study demonstrates the feasibility of using FAPI PET/CT imaging for non-invasive assessment of lupus nephritis lesions. Elevated FAP expression in lupus nephritis is primarily expressed by RTEC and contributes to the development of interstitial fibrosis. Type I interferon appears to induce FAP expression. These findings provide insights into the molecular mechanisms underlying renal tubulointerstitial fibrosis in lupus nephritis and offer a valuable tool for assessing kidney status in this condition.
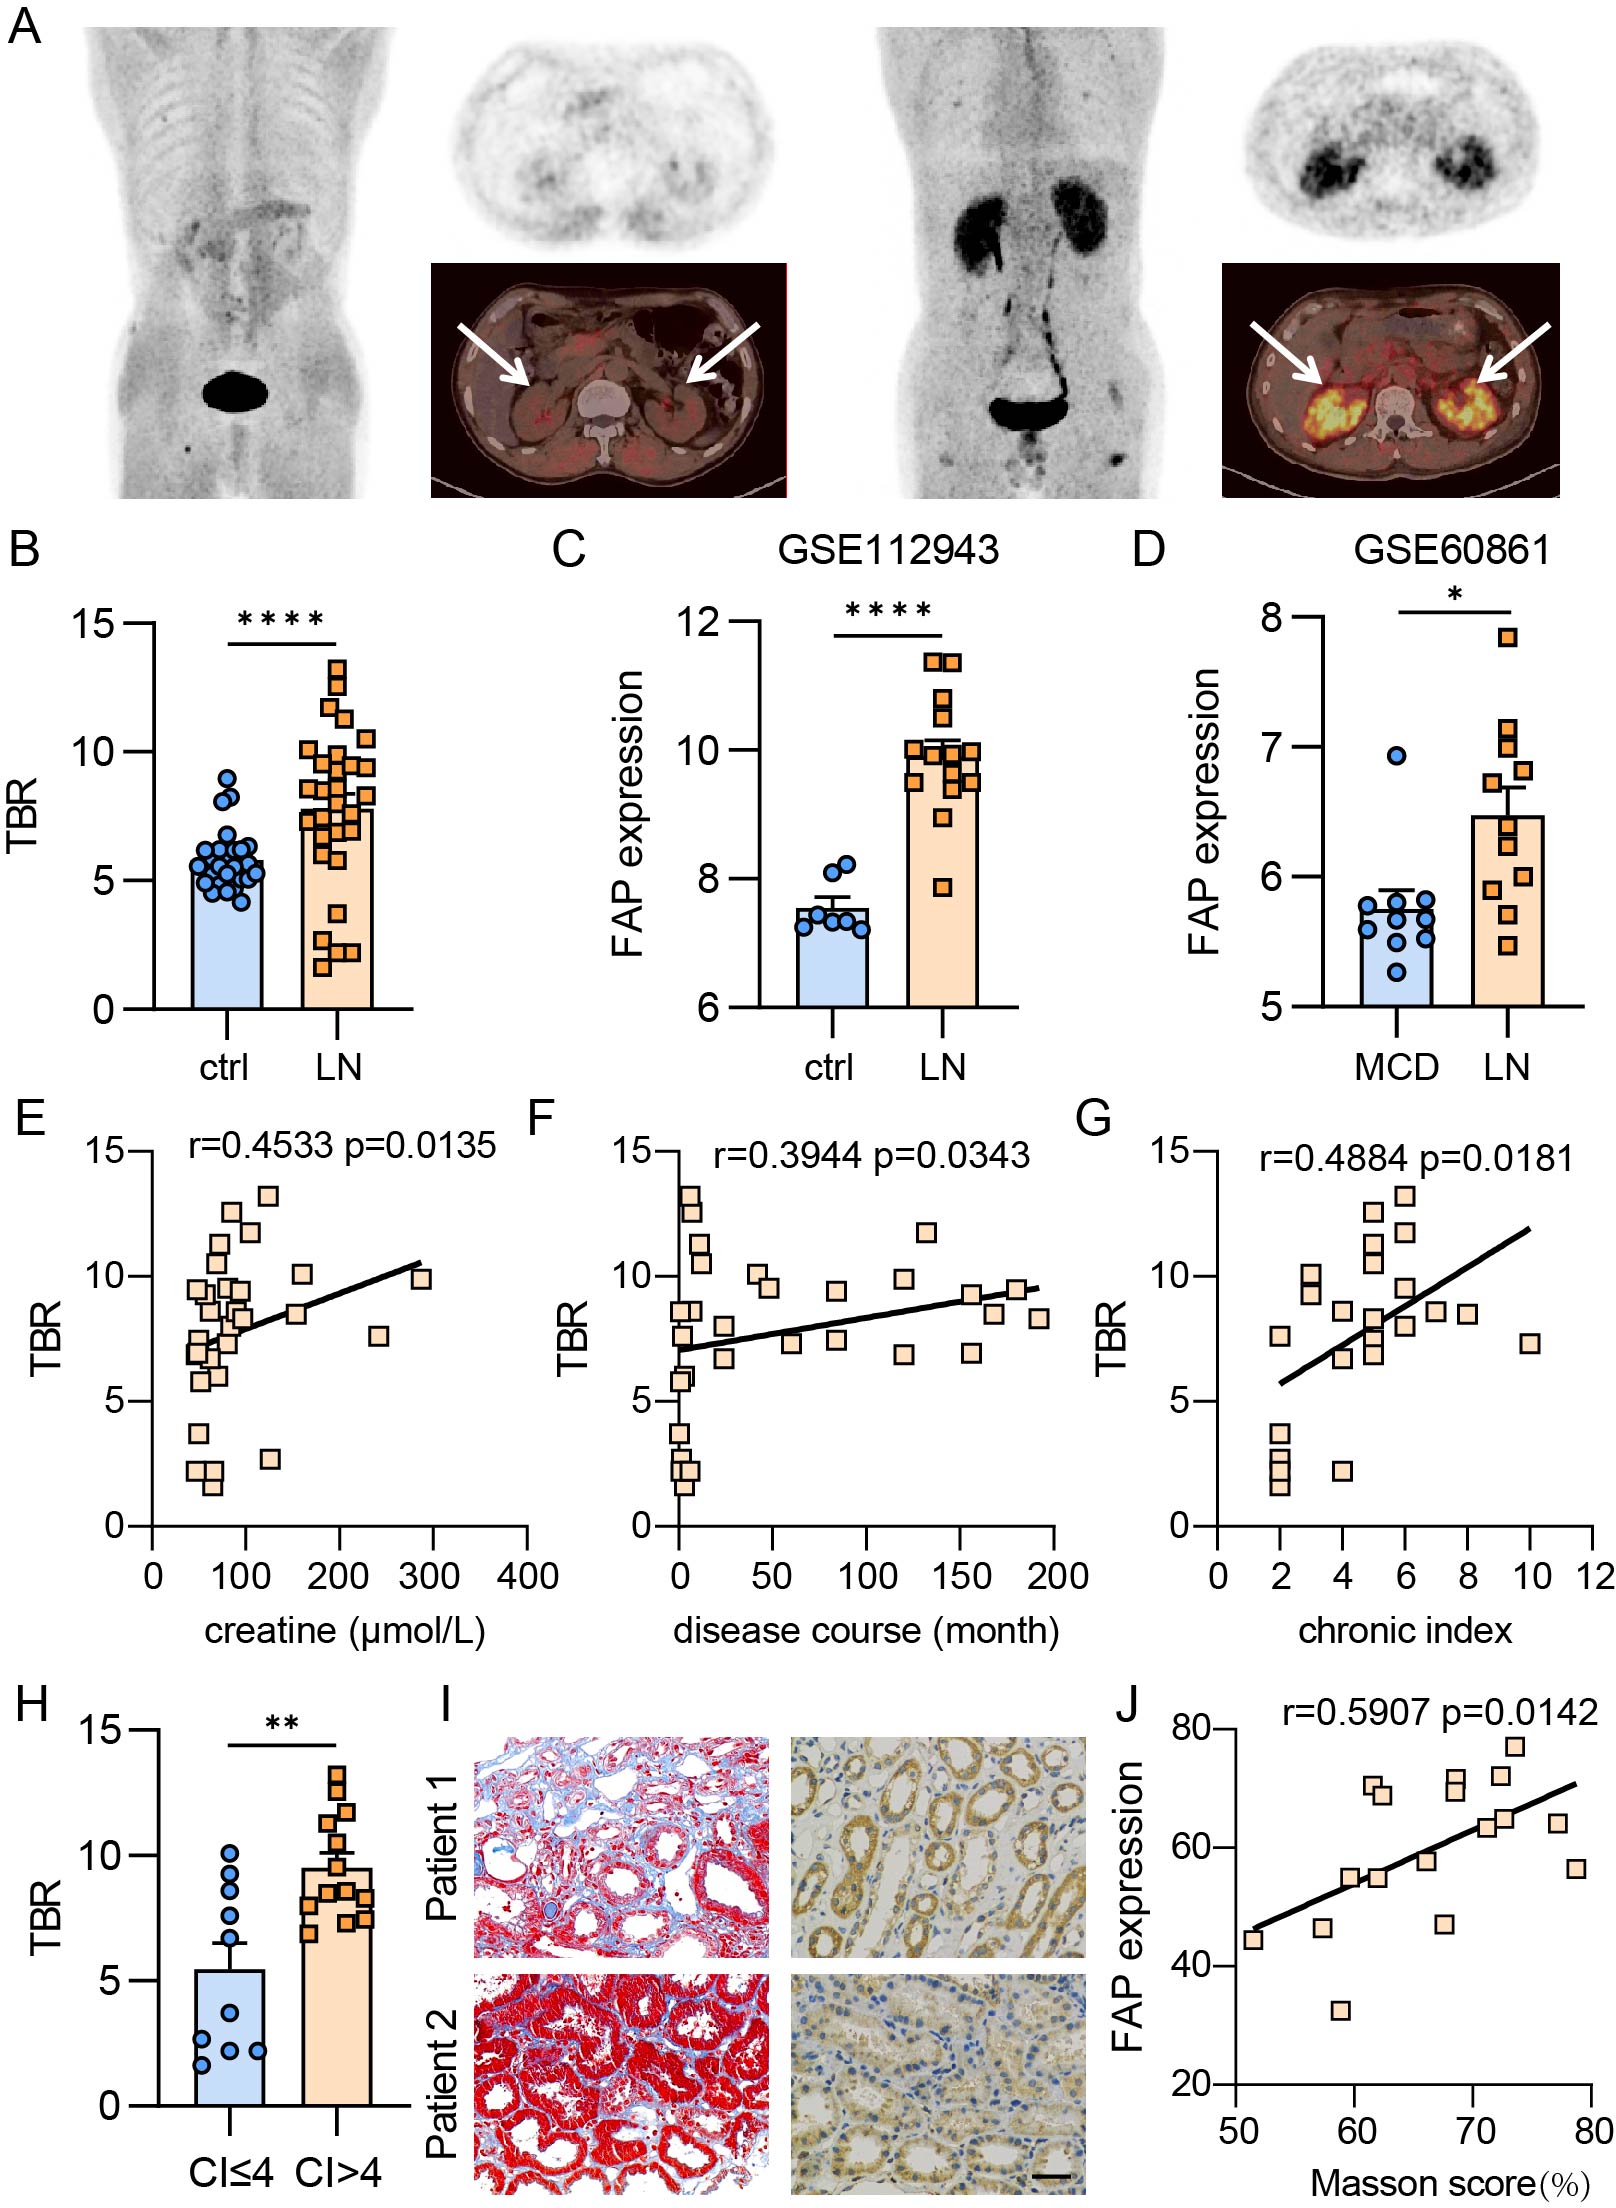
(A) Left: Representative 68Ga-FAPI PET/CT scan from healthy control, showing minimal tracer accumulation. Right: Representative 68Ga-FAPI PET/CT scan from a patient with lupus nephritis, showing significant tracer accumulation (indicated by arrows). (B) Comparison of the target-to-background ratio (TBR) of 68Ga-FAPI uptake between patients with lupus nephritis and healthy controls. (C) Analysis of FAP expression at mRNA level in lupus nephritis using data from the GSE112943 public database. (D) Analysis of FAP expression at mRNA level in lupus nephritis compared to minimal change disease (MCD) using data from the GSE60861 public database. (E) Pearson’s correlation between FAPI TBR and creatinine levels. (F) Pearson’s correlation between FAPI TBR and disease duration. (G) Pearson’s correlation between FAPI TBR and chronic kidney histology scores. (H) Comparison of TBR values in patients with chronic index scores greater than 4 versus those with scores of 4 or less. (I) Representative images of Masson’s trichrome staining and FAP immunohistochemistry (IHC) from renal biopsy specimens of healthy controls and lupus nephritis patients (scale bars, 25 μm). Patient 1: Lupus nephritis with 1.5 years of disease duration, obvious tubulointerstitial fibrosis, and elevated creatinine. Patient 2: First-onset lupus nephritis with no significant tubulointerstitial fibrosis and normal creatinine levels. (J) Pearson’s correlation between FAP IHC scores (measured by IHC Profiler) and Masson scores. (*P < 0.05; **P < 0.01; ***P < 0.001; ****P < 0.0001)
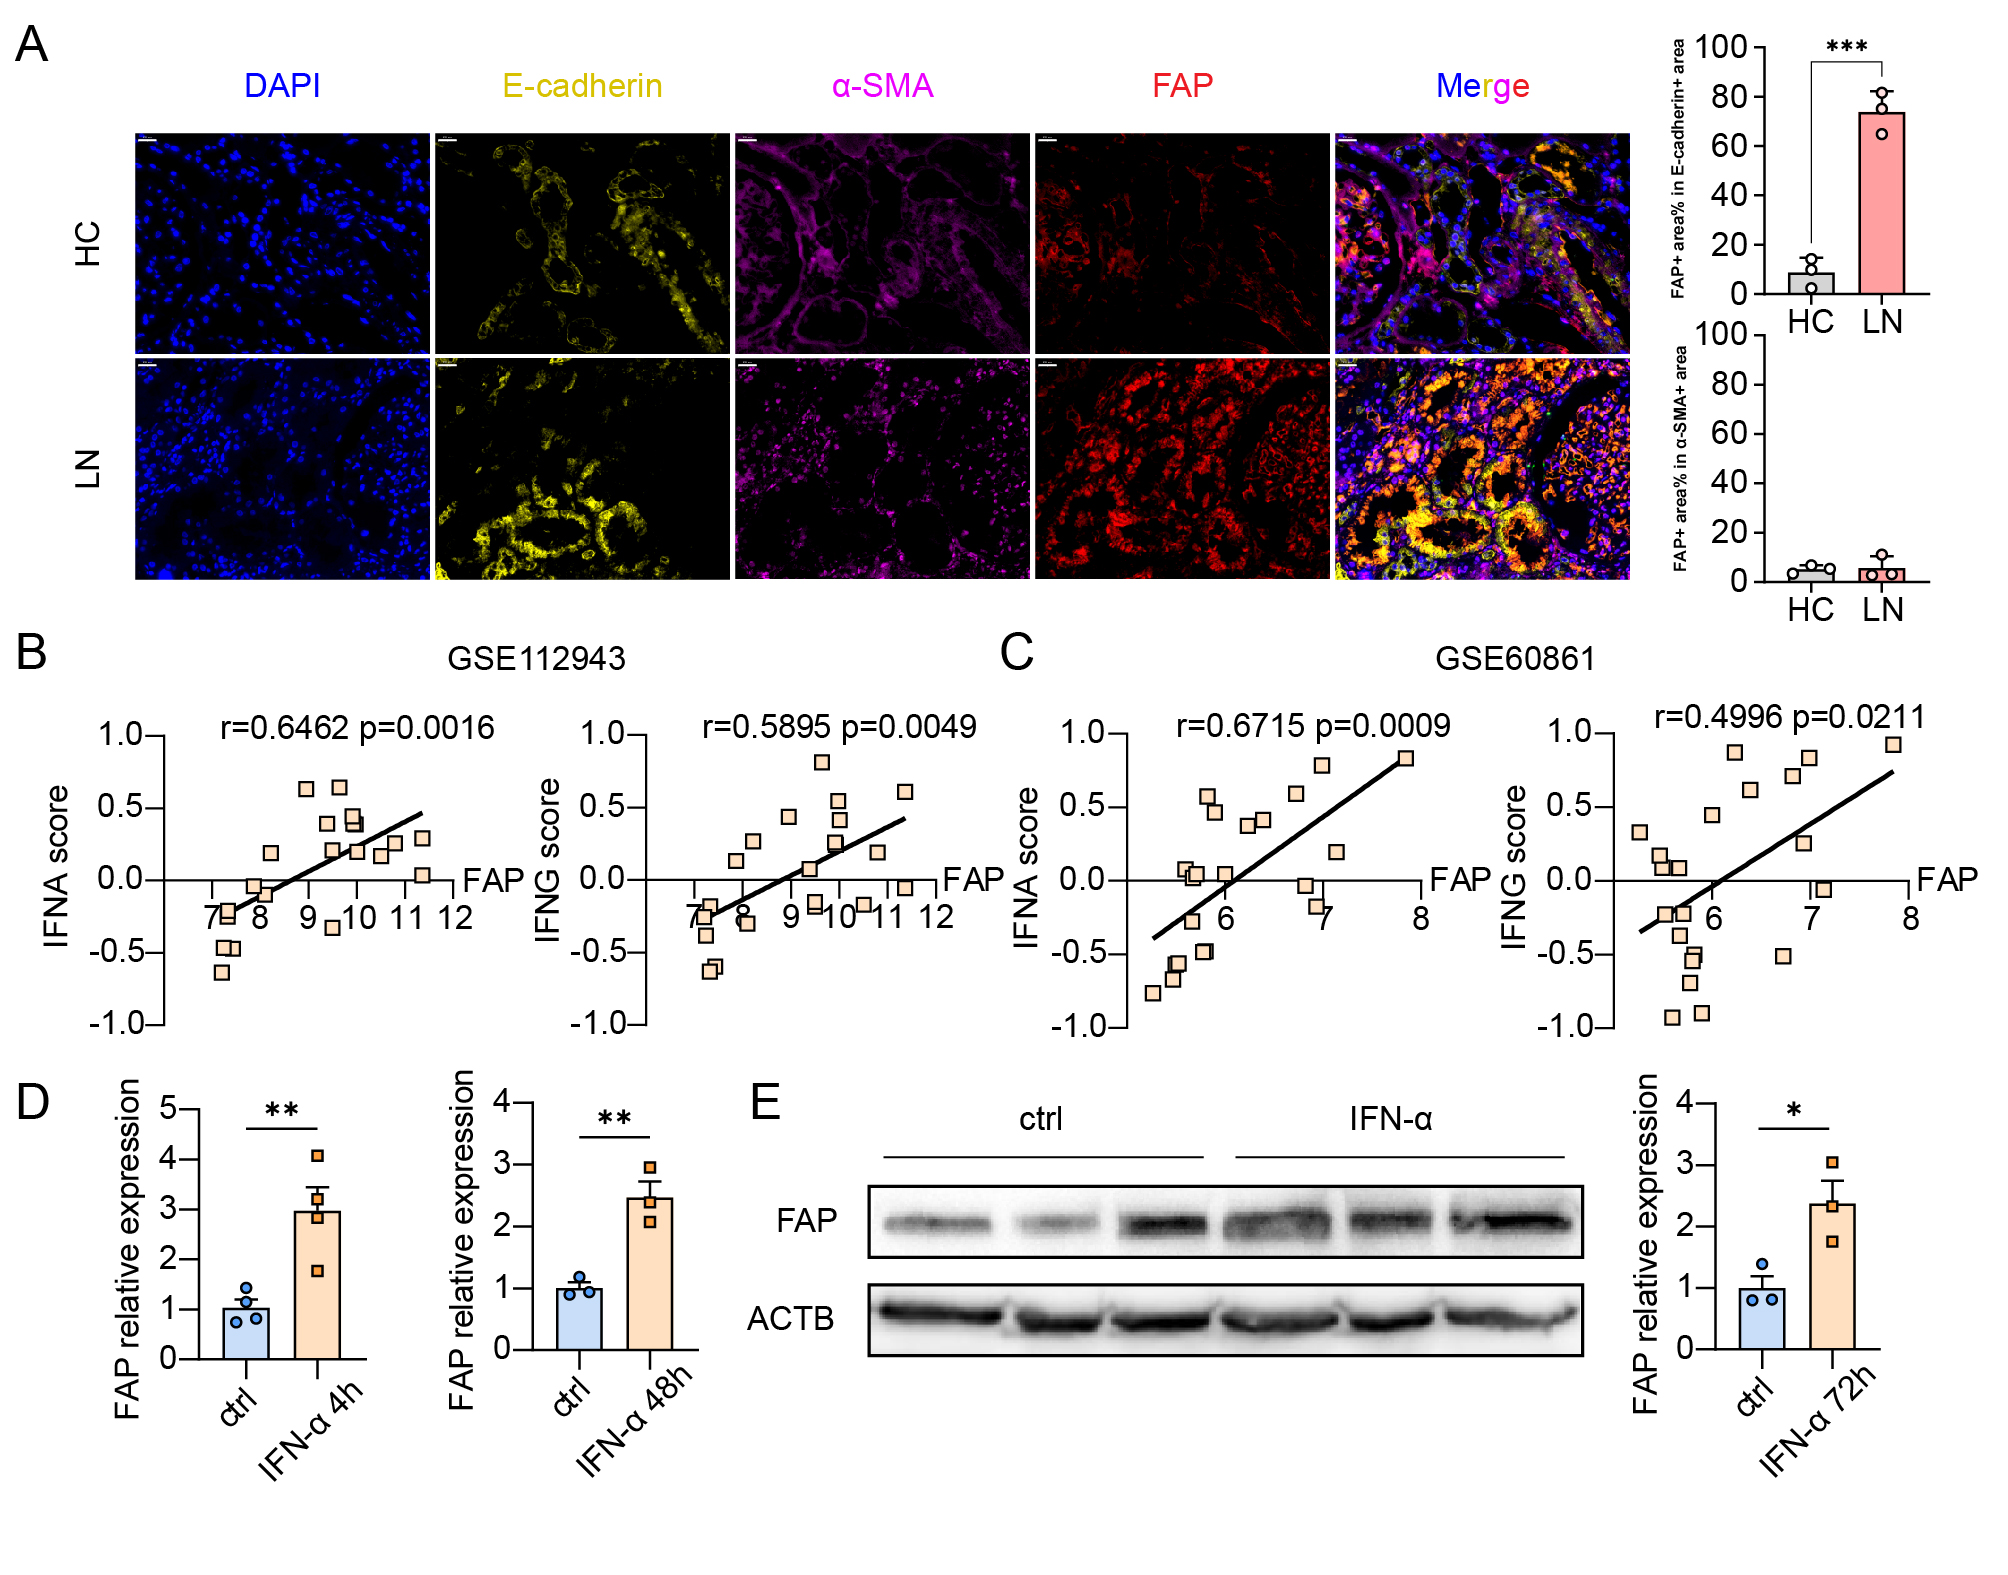
(A) Immunofluorescence staining of renal biopsy specimens from healthy controls and patients with lupus nephritis, showing DAPI (blue), E-cadherin (yellow), α-SMA (purple), and FAP (red), at 400x magnification (scale bars, 20 μm). Right: Co-localization analysis of FAP. Top right: Percentage of FAP positive area within E-cadherin positive area. Bottom right: Percentage of FAP positive area within α-SMA positive area. (B) Pearson’s correlation between IFN-α score and FAP expression (left, r=0.6462, p=0.0016), and between IFN-γ score and FAP expression (right, r=0.5895, p=0.0049) from GSE112943. (C) Pearson’s correlation between IFN-α score and FAP expression (left, r=0.6715, p=0.0009), and between IFN-γ score and FAP expression (right, r=0.4996, p=0.0211) from GSE60861. (D) Quantification of relative FAP mRNA expression in renal tubular epithelial cells (HK_2). FAP expression was significantly higher upon stimulation with IFN-α for 4 and 48 hours compared to controls (**P < 0.01). (E) Relative protein abundance of FAP in HK_2 cells upon stimulation with IFN- α for 72 hours, with representative Western blots and corresponding quantification (*P < 0.05).
To cite this abstract in AMA style:
Yu S, Ding Z, Pan H, Qian J, Yang Z, Wei X, Yang C, Shi H. 68Ga-FAPI PET/CT Imaging for Assessing Renal Tubulointerstitial Fibrosis in Lupus Nephritis [abstract]. Arthritis Rheumatol. 2024; 76 (suppl 9). https://acrabstracts.org/abstract/68ga-fapi-pet-ct-imaging-for-assessing-renal-tubulointerstitial-fibrosis-in-lupus-nephritis/. Accessed .« Back to ACR Convergence 2024
ACR Meeting Abstracts - https://acrabstracts.org/abstract/68ga-fapi-pet-ct-imaging-for-assessing-renal-tubulointerstitial-fibrosis-in-lupus-nephritis/