Session Information
Session Type: Abstract Session
Session Time: 3:00PM-4:30PM
Background/Purpose: The specific bony changes of osteophyte growth and “bone attrition” (broadening and flattening of the femoral condyles) associated with OA have been recognized in radiographs for many years. Recently, the development of automated measurement of a z-score of true 3D knee femoral bone shape (“B-score”) from MR or CT images has demonstrated that bone shape may provide a continuous indication of OA status, may predict future OA onset, and is associated with patient-important endpoints such as pain, loss of function and joint replacement [1]. Here we explore longitudinal changes of this bone shape measure.
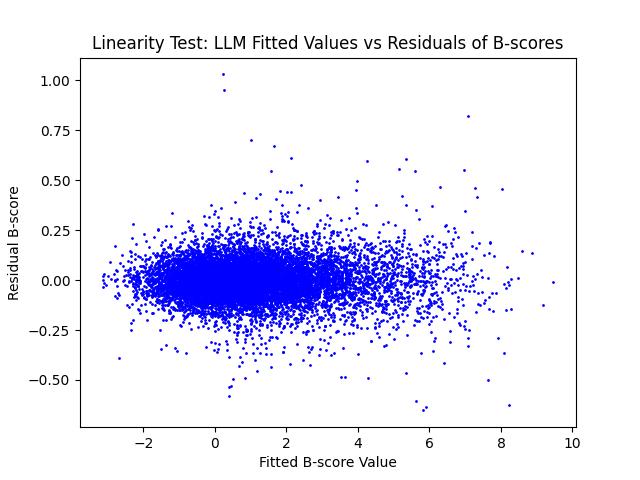
Methods: B-scores were automatically derived from Osteoarthritis Initiative DESS MR images of all knees that had images of the right knee acquired at baseline, 1, 2, 3 and 4-year timepoints, using the same imaging coil. Total number of days from baseline for each acquisition was used to calculate time intervals. B-score slopes were modelled by linear least-squares (LLM) regression over 4 years. The average slopes were compared for Kellgren-Lawrence Grade (KLG) baseline status. We tested negative slopes against a null hypothesis of a zero slope at a significance level of p< 0.05. Linearity of slopes was tested by comparison of fitted B-score values from the LLM with the residual at each timepoint. Akaike and Bayesian Information Criterion tests both indicated an optimal 3-components for a Gaussian Mixture Model of the B-score slope distribution
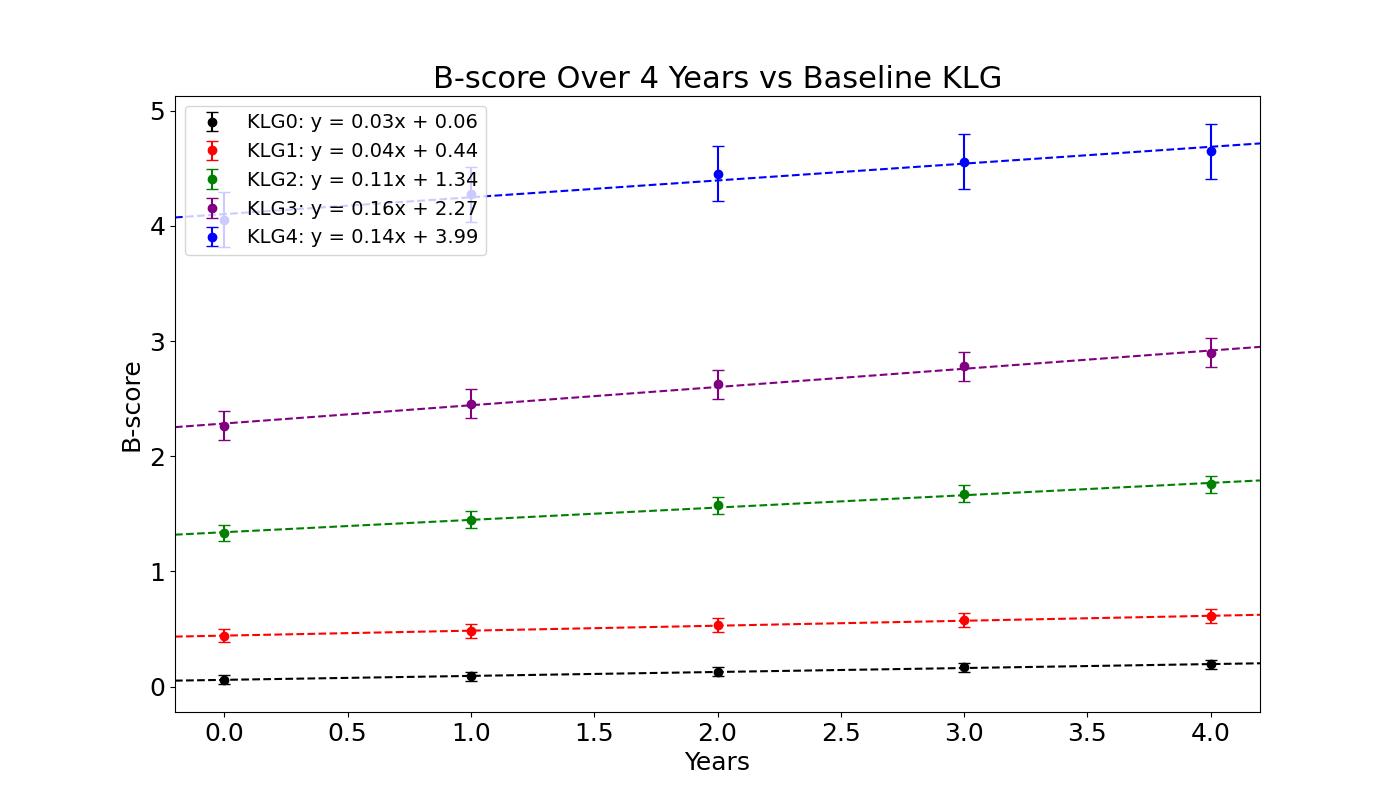
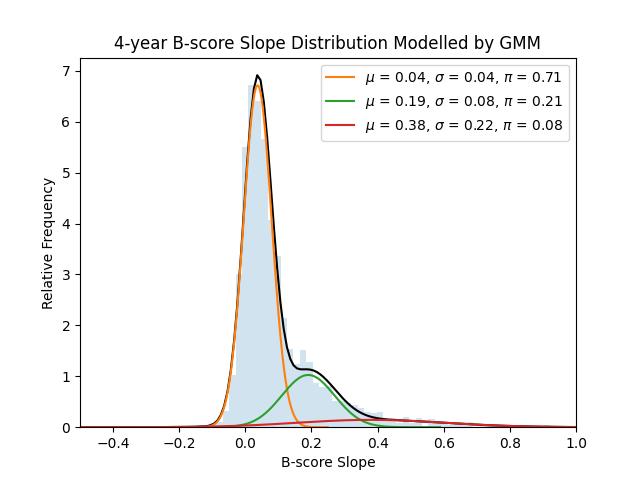
Results: The analysis set comprised 2371 knees (44% male) with baseline KLG of 0: 941, 1: 465, 2: 606, 3: 303, 4: 54. Average slopes and intercepts from LLM for each KLG are shown in Fig. 1. The number of negative slopes significantly different (p< 0.05) from zero was 13 (3.7% of all 352 negative slopes). Fig. 2 shows that distribution of the LLS fitted B-score values compared to residuals for all subjects and timepoints was centered on zero, with no off-axis trend, indicating that B-score slopes are homoscedastic and linear. The three-component GMM of the distribution of B-score annual slopes is shown in Fig. 3 with the mean (µ), standard deviation (σ) and probability of an individual knee being in the component (π) reported for each Gaussian component.
Conclusion: We found no evidence of negative bone shape slopes which might indicate bone shape reverting to a less pathological state. Instead, bone shape changes associated with OA were unidirectional and linear, at least over 4 years, supporting the use of this measurement in clinical trials. The KL grades associated with normal or doubtful radiographic OA (0/1) appear to have very small annual B-score slopes of ~0.04 per annum, whereas KLG2-4 all have slopes ~3-4x larger indicating a larger proportion of faster bone shape progressors at the higher KL grades. The GMM result suggests three B-score trajectories: a normal “aging” mean annual rate of 0.04 (comprising 71% of our sample set) and an OA “progression” mean rate of 0.19 (21% of the set). A third mean rate of 0.38 (8% of the set) may indicate a more rapid progressor subgroup or variability related to measurement at higher rates of progression.
[1] Bowes et al. (2021) ARD 80(4) 502-508.
To cite this abstract in AMA style:
Brett A, Conaghan P, Bowes M. 3-dimensional Shape Changes of the Knee over 4 Years Are Linear and Progressive but Much More Rapid in Osteoarthritic Joints: Data from the Osteoarthritis Initiative [abstract]. Arthritis Rheumatol. 2024; 76 (suppl 9). https://acrabstracts.org/abstract/3-dimensional-shape-changes-of-the-knee-over-4-years-are-linear-and-progressive-but-much-more-rapid-in-osteoarthritic-joints-data-from-the-osteoarthritis-initiative/. Accessed .« Back to ACR Convergence 2024
ACR Meeting Abstracts - https://acrabstracts.org/abstract/3-dimensional-shape-changes-of-the-knee-over-4-years-are-linear-and-progressive-but-much-more-rapid-in-osteoarthritic-joints-data-from-the-osteoarthritis-initiative/


