Session Information
Date: Wednesday, October 29, 2025
Title: Abstracts: Rheumatoid Arthritis – Treatment II: Phenotyping and Personalization (2639–2644)
Session Type: Abstract Session
Session Time: 10:45AM-11:00AM
Background/Purpose: TNF inhibitors (TNFi) are the most common biologic DMARD used to treat RA; however, no robust biomarkers have been established to predict likelihood of a good response to them. We hypothesized that detailed cellular profiling on blood samples from RA patients can identify specific immune cell features in baseline samples that are associated with TNFi treatment response. We assessed blood samples from 97 RA patients from a randomized trial to identify cellular features associated with response to TNFi or triple therapy.
Methods: We utilized PBMCs collected as part of the TARGET trial (Solomon et al., Ann Rheum Dis, 2023), which randomized RA patients with an inadequate response to methotrexate to either TNFi (adalimumab or etanercept; n=51) or triple therapy (sulfasalazine and hydroxychloroquine; n = 47). Patients were 72% female with a median age of 60. Treatment response was determined by DAS28 EULAR response criteria at 24 weeks (66% responders in TNFi arm, 69% responders in triple therapy arm). We performed scRNA-seq on PBMCs from baseline and week 24 followed by unsupervised clustering. Data were analyzed using covarying neighborhood analysis (CNA), mixed effects association of single cell analysis (MASC), Wilcoxon paired tests, and differential gene expression analyses.
Results: To define cellular phenotypes affected by TNFi therapy, we compared baseline and week 24 samples. TNFi induced substantial changes in phenotypes of every major immune cell lineage (Fig1). Our analyses highlighted shifts in phenotypes of classical CD14+ CD16- monocytes comparing baseline and week 24 TNFi samples. These changes were observed in TNFi treated patients and not in the triple therapy group (Fig2A-B). To identify cellular features in baseline samples associated with subsequent response to TNFi, we compared immune profiles of baseline samples from TNFi responders and non-responders. Abundance of a monocyte phenotype which corresponded precisely to the monocytes strongly reduced by TNFi in longitudinal analyses differed significantly between TNFi responders and non-responders (Fig2C). These monocytes express inflammatory factors including IL1b and CCL2 and several chemokines are more highly expressed in baseline monocytes of TNFi responders as compared to non-responders (Fig2D). Transcriptomic mapping of myeloid cells from this blood scRNA-seq to myeloid cells from RA synovial tissue revealed similarities of the TNFi response-associated monocytes to inflammatory macrophages in RA synovial tissue (Fig3). Analysis of differentially expressed genes encoding surface proteins yielded a candidate list of surface factors, which we validated by flow cytometry. Cytometry quantification of these markers correlated with change in DAS28 in TNFi treated patients and successfully reproduced the discrimination of TNFi responders and non-responders in a subset of TARGET patients (n=18).
Conclusion: Immune profiling of blood from RA patients by scRNA-seq has identified monocytes in blood that are expanded pre-treatment in responders to TNFi. These monocytes can be quantified in blood using a simple cytometry test, which may facilitate translation of a predictive biomarker test to clinical application.
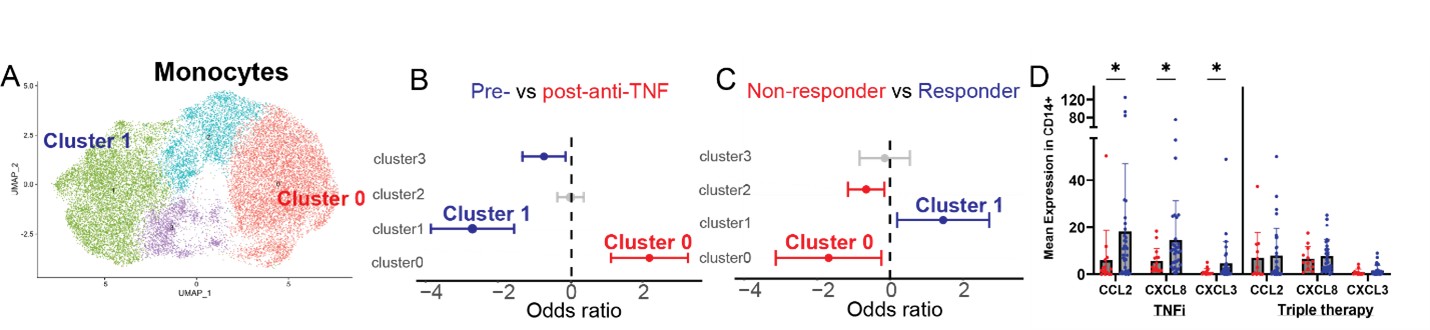 Figure 1. A) scRNAseq of PBMCs from TNFi-treated RA patients, including cells from baseline (pre-treatment) and week 24 post-treatment samples (~355K cells). B) Covarying neighborhood analysis (CNA) showing changes in all major PBMC populations associated with TNFi therapy. p < 0.01 and FDR < 0.1 and adjusted for age and sex.
.jpg) Figure 2. Identification of a monocyte population associated with TNFi treatment response. A) UMAP of monocytes from scRNAseq of TNFi-treated patients in TARGET. B) MASC analysis demonstrating clusters associated with baseline (pre-treatment) or week 24 (post-treatment) samples in the TNFi treated cohort. C) MASC analysis demonstrating clusters in baseline (pre-treatment) samples associated with responders or non-responders to TNFi therapy. D) Mean expression of CCL2, CXCL8 and CXCL3 at baseline in responders and non-responders to TNFi or triple therapy.
Figure 2. Identification of a monocyte population associated with TNFi treatment response. A) UMAP of monocytes from scRNAseq of TNFi-treated patients in TARGET. B) MASC analysis demonstrating clusters associated with baseline (pre-treatment) or week 24 (post-treatment) samples in the TNFi treated cohort. C) MASC analysis demonstrating clusters in baseline (pre-treatment) samples associated with responders or non-responders to TNFi therapy. D) Mean expression of CCL2, CXCL8 and CXCL3 at baseline in responders and non-responders to TNFi or triple therapy.
.jpg) Figure 3. Mapping TNFi treatment-response associated monocytes in blood to RA synovial myeloid populations. A) Myeloid cells from TARGET PBMCs. The red cluster indicates the cluster associated with TNFi response. B) UMAP of RA synovial myeloid cells from synovial tissue generated through AMP (Zhang et al, Nature, 2023). C) Mapping of TARGET myeloid cells to AMP synovial myeloid cells. The colors match the cluster source of each cell shown in A.
Figure 3. Mapping TNFi treatment-response associated monocytes in blood to RA synovial myeloid populations. A) Myeloid cells from TARGET PBMCs. The red cluster indicates the cluster associated with TNFi response. B) UMAP of RA synovial myeloid cells from synovial tissue generated through AMP (Zhang et al, Nature, 2023). C) Mapping of TARGET myeloid cells to AMP synovial myeloid cells. The colors match the cluster source of each cell shown in A.
To cite this abstract in AMA style:
Marks K, Horisberger A, Adejoorin I, Santacroce L, Elahee M, Bathon J, Wei K, Solomon D, Rao D. Single Cell RNA-seq Profiling Reveals a Blood Monocyte Phenotype Associated with Response to TNF Inhibitor Therapy in RA Patients [abstract]. Arthritis Rheumatol. 2025; 77 (suppl 9). https://acrabstracts.org/abstract/single-cell-rna-seq-profiling-reveals-a-blood-monocyte-phenotype-associated-with-response-to-tnf-inhibitor-therapy-in-ra-patients/. Accessed .« Back to ACR Convergence 2025
ACR Meeting Abstracts - https://acrabstracts.org/abstract/single-cell-rna-seq-profiling-reveals-a-blood-monocyte-phenotype-associated-with-response-to-tnf-inhibitor-therapy-in-ra-patients/