Session Information
Date: Monday, October 27, 2025
Title: Plenary II (0849–0854)
Session Type: Plenary Session
Session Time: 8:30AM-8:45AM
Background/Purpose: Kidney survival is the ultimate treatment goal in lupus nephritis (LN), but long-term predictors remain understudied due to the need for extensive follow up. Proteinuria at one year is used to establish treatment response, but it is inadequate: repeat biopsy studies showed persistent intrarenal activity in ~50% of proteinuric responders with up to 30% progressing to renal insufficiency. Our objective was to identify urinary biomarkers that predict kidney function loss.
Methods: We followed 170 LN patients from the Accelerating Medicines Partnership (AMP) cohort up to 7.8 years (median 4.9). Treatment was discretionary. Estimated Glomerular Filtration Rate (eGFR) loss was defined as a sustained ≥40% decline in eGFR from baseline or development of end-stage kidney disease. We quantified 1200 biomarkers (RayBiotech) in urine samples collected at time of kidney biopsy and month 3, 6, and 12 in LN. Time-to-event models were used to evaluate associations between urinary protein levels and risk of future eGFR loss. Kidney single-cell RNA-seq and spatial transcriptomics (Xenium) were used to identify the renal cellular source of biomarkers. A Random Survival Forest model was trained to predict eGFR loss at any time after baseline and validated on a 20% hold-out test set.
Results: During follow-up, 53/170 (31%) patients developed eGFR loss. At month 3, Tenascin C emerged as the strongest predictor of eGFR loss (HR 4.6) and remained elevated through month 12 (Figure 1). Several inflammatory and fibrosis-associated markers (i.e., CD163, CD206, FABP4, IL6, IGFBP-6) were persistently associated with increased risk. Single-cell and spatial transcriptomics localized Tenascin C expression to interstitial myofibroblasts in LN kidneys, suggesting a pathologic role in progressive fibrosis (Figure 2). To maximize clinical applicability, we developed a urinary protein-based classifier to predict future eGFR loss at any time point after baseline. The model (11-proteins, including tenascin C) achieved excellent predictive performance (AUC = 0.91 at 48 months) stratifying patients into high- and low-risk groups (Figure 3A). For example, at month 12, the risk score was significantly associated with eGFR preservation (p < 0.001, Figure 3B), and revealed heterogeneity within proteinuric response groups: some responders (UPCR < 0.5) had high risk scores, while some non-responders had low scores (Figure 3C). The classifier accurately predicted eGFR loss in both groups underscoring the limitations of proteinuria and the added utility of biomarker-based risk prediction (Figure 3D-E).
Conclusion: Urinary Tenascin C, a marker of myofibroblast activation, emerged as a robust predictor of kidney function loss in LN. Elevated CD163 and CD206 levels in high-risk patients point to ongoing M2 macrophage–driven profibrotic signaling and incomplete resolution of intrarenal inflammation, even among proteinuric responders. A proteomics-based risk score outperformed proteinuria, accurately stratifying high-risk individuals regardless of response. These findings offer mechanistic insight and support early biomarker-guided strategies to personalize treatment, refine clinical trials, and prevent irreversible kidney damage.
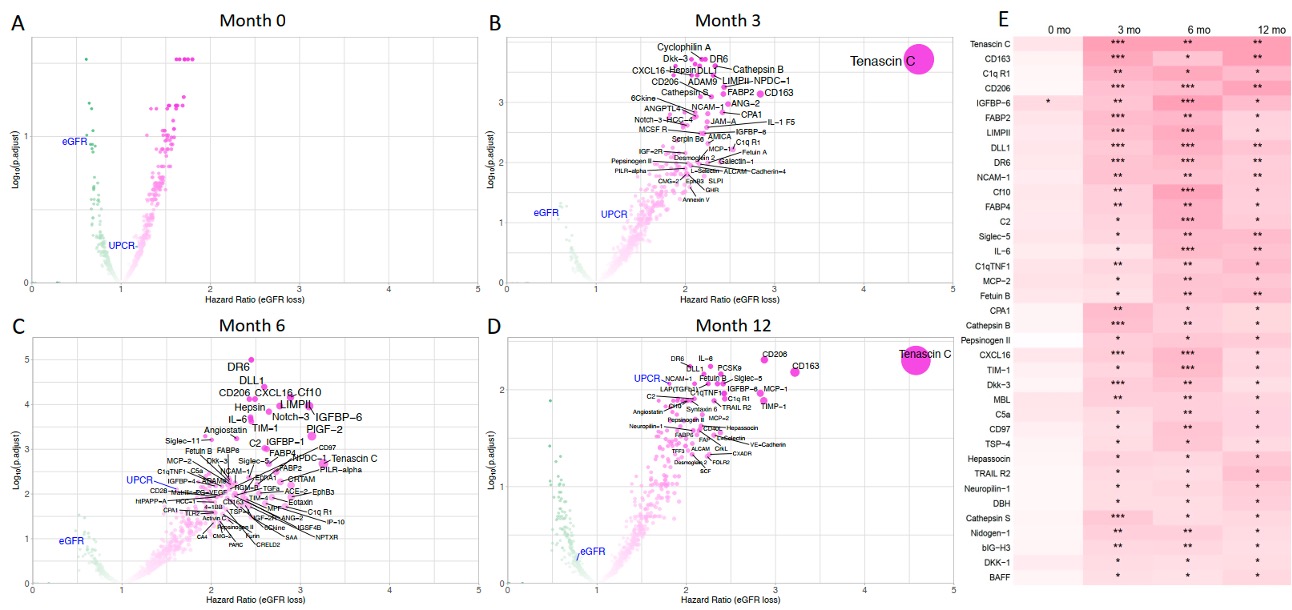 Figure 1. Proteomics signatures of increased risk of eGFR loss over time. Cox regression results at month 0, 3, 6, 12 (A-D). Only proteins with a significant hazard ratio greater than 2 are labeled on the four volcano plots. eGFR and UPCR are labeled in blue. (E) Heatmap summarizing urinary proteins significantly associated with eGFR loss from month 3 onward. Color intensity indicates the hazard ratio (HR) for eGFR loss, with white representing HR = 1 and deeper red shades indicating higher HR values. *: adjusted p < 0.05; **: adjusted p < 0.01; ***: adjusted p < 0.001. eGFR: estimated Glomerular Filtration Rate; UPCR: urine protein-to-creatinine ratio.
.jpg) Figure 2. Tenascin C is broadly expressed in LN by myofibroblasts. (A) UMAP projection of ~ 500k cells from 16 kidney biopsies profiled using Xenium and scFFPE RNA sequencing from the AMPAIM cohort. Each cluster is labeled by its inferred cell type, and cells are colored by log-normalized expression of Tenascin C (TNC). The interstitial stromal cluster is highlighted in the red circle. (B) Violin plots of TNC expression across interstitial subpopulations): vascular smooth muscle cells (VSMC, n=3,854), VSMC/pericytes (VSMC/P, n=5,458), VSMC/endothelial cells (VSMC/EC, n=2,933), fibroblasts (Fib, n=3,584), and myofibroblasts (Myofib, n=1,220). Myofibroblasts show the highest TNC levels, indicating this cell type as the primary source. Data generated from the AMP RA/SLE cohort (n=200) using 10X Genomics scRNA-seq technology on disaggregated kidney biopsies. (C) Spatial transcriptomic map (10× Xenium) of a representative LN kidney section: yellow circles mark TNC transcript density, demonstrating broad expression within interstitial regions (scale bar = 2000 µm).
Figure 2. Tenascin C is broadly expressed in LN by myofibroblasts. (A) UMAP projection of ~ 500k cells from 16 kidney biopsies profiled using Xenium and scFFPE RNA sequencing from the AMPAIM cohort. Each cluster is labeled by its inferred cell type, and cells are colored by log-normalized expression of Tenascin C (TNC). The interstitial stromal cluster is highlighted in the red circle. (B) Violin plots of TNC expression across interstitial subpopulations): vascular smooth muscle cells (VSMC, n=3,854), VSMC/pericytes (VSMC/P, n=5,458), VSMC/endothelial cells (VSMC/EC, n=2,933), fibroblasts (Fib, n=3,584), and myofibroblasts (Myofib, n=1,220). Myofibroblasts show the highest TNC levels, indicating this cell type as the primary source. Data generated from the AMP RA/SLE cohort (n=200) using 10X Genomics scRNA-seq technology on disaggregated kidney biopsies. (C) Spatial transcriptomic map (10× Xenium) of a representative LN kidney section: yellow circles mark TNC transcript density, demonstrating broad expression within interstitial regions (scale bar = 2000 µm).
.jpg) Figure 3. Urinary proteomics-based risk score predicts renal function loss and stratifies patients by treatment response. (A) Time-dependent ROC curve at 48 months demonstrates predictive performance of the risk score, with an optimal Youden cutoff of 9.65 separating high- and low-risk groups for eGFR decline. An 80:20 data split was used for model development, with 80% of patients in the training set and 20% held out for independent testing. Cross-validation within the training set optimized model hyperparameters. All follow-up visits were used to train the model to predict future eGFR loss. To prevent data leakage and overfitting, patients were split at the subject level, ensuring that all visits from a given patient remained in either the training or test set. (B) Kaplan-Meier kidney survival analysis for all patients, stratified by risk score at month 12. Patients with scores ≥9.65 were classified as high risk; those < 9.65 as low risk. (C) Distribution of risk scores by treatment response at month 12. (D-E) Kidney survival stratified by risk score among proteinuric responders (D, UPCR < 0.5) and non-responders (E, UPCR ≥ 0.5).
Figure 3. Urinary proteomics-based risk score predicts renal function loss and stratifies patients by treatment response. (A) Time-dependent ROC curve at 48 months demonstrates predictive performance of the risk score, with an optimal Youden cutoff of 9.65 separating high- and low-risk groups for eGFR decline. An 80:20 data split was used for model development, with 80% of patients in the training set and 20% held out for independent testing. Cross-validation within the training set optimized model hyperparameters. All follow-up visits were used to train the model to predict future eGFR loss. To prevent data leakage and overfitting, patients were split at the subject level, ensuring that all visits from a given patient remained in either the training or test set. (B) Kaplan-Meier kidney survival analysis for all patients, stratified by risk score at month 12. Patients with scores ≥9.65 were classified as high risk; those < 9.65 as low risk. (C) Distribution of risk scores by treatment response at month 12. (D-E) Kidney survival stratified by risk score among proteinuric responders (D, UPCR < 0.5) and non-responders (E, UPCR ≥ 0.5).
To cite this abstract in AMA style:
LEE C, Taghavi S, Zhang S, Madhu R, Shwetar J, O'Malley T, Goldman D, Izmirly P, Belmont H, Furie R, Schwartz N, Putterman C, Barnas J, Anolik J, French S, Dall'Era M, James J, Guthridge J, Vasquez J, Nerenberg M, Concoff A, Schleif C, Wei K, Eisenhaure T, Hacohen N, Bogle R, Gudjonsson J, Tsoi L, Rovin B, Buyon J, Petri M, Fava A. Urinary Tenascin C Predicts Kidney Function Loss in Lupus Nephritis [abstract]. Arthritis Rheumatol. 2025; 77 (suppl 9). https://acrabstracts.org/abstract/urinary-tenascin-c-predicts-kidney-function-loss-in-lupus-nephritis/. Accessed .« Back to ACR Convergence 2025
ACR Meeting Abstracts - https://acrabstracts.org/abstract/urinary-tenascin-c-predicts-kidney-function-loss-in-lupus-nephritis/