Session Information
Session Type: Poster Session A
Session Time: 10:30AM-12:30PM
Background/Purpose: Ultrasound (US) is an emerging, promising imaging modality offering a safe, radiation-free, and cost-effective option for diagnosing and assessing structural changes in knee osteoarthritis (KOA), potentially overcoming limitations of current gold-standard modalities such as X-ray and MRI. Despite growing interest in US capabilities, its diagnostic performance remains variable across studies, with no clear agreement on its accuracy compared to standard reference methods. This systematic review and meta-analysis aims to evaluate the diagnostic accuracy of US in detecting KOA and related parameters.
Methods: We conducted a systematic review and meta-analysis following PRISMA guidelines (Fig 1). PubMed, Web of Science, and Scopus were searched from inception to April 4th 2025, for studies evaluating US diagnostic accuracy in detecting KOA. Studies were included if they provided sufficient data to construct 2×2 tables and used a valid reference standard. A meta-analysis estimated pooled sensitivity (Se), specificity (Sp), and the summary receiver operating characteristic (SROC) curve of US for diagnosing KOA and related parameters. All analyses were performed using R software 4.4.2.
Results: We included 27 studies in the qualitative synthesis and 17 in the meta-analysis, encompassing 7,187 and 3,871 knee radiographs, respectively. US achieved a pooled Se of 0.94 (95% CI: 0.71–0.99) and Sp of 0.79 (95% CI: 0.48–0.94) for total KL grading (Fig. 2). For KL grade 0, Se was 0.47 (95% CI: 0.12–0.85) and Sp was 0.98 (95% CI: 0.19–1.00). For KL grade 1, Se was 0.95 (95% CI: 0.53–1.00) and Sp was 0.89 (95% CI: 0.44–0.99). For KL grade 2, Se was 0.99 (95% CI: 0.69–1.00) and Sp was 0.86 (95% CI: 0.48–0.97). For KL grade 3, Se was 0.87 (95% CI: 0.82–0.91) and Sp was 0.90 (95% CI: 0.67–0.98). For KL grade 4, Se was 0.94 (95% CI: 0.84–0.98) and Sp was 0.97 (95% CI: 0.42–1.00) (Fig. 3). For osteophyte detection, Se was 0.86 (95% CI: 0.76–0.92) and Sp was 0.76 (95% CI: 0.65–0.84). For cartilage degeneration, Se was 0.88 (95% CI: 0.71–0.95) and Sp was 0.76 (95% CI: 0.73–0.79). For medial meniscus protrusion (MMP), Se was 0.77 (95% CI: 0.56–0.90) and Sp was 0.70 (95% CI: 0.47–0.86) (Fig. 2).
Conclusion: This systematic review and meta-analysis is the first to assess US diagnostic accuracy in detecting KOA and KOA-related structural changes, showing high pooled sensitivity and specificity for overall KL grading, individual KL grades, and the detection of osteophytes, cartilage degeneration, and MMP. Future research should focus on enhancing early stage KOA detection by US for more timely diagnosis and intervention, and explore the link between clinical symptoms and ultrasound findings to better understand how imaging correlates with patient reported outcomes.
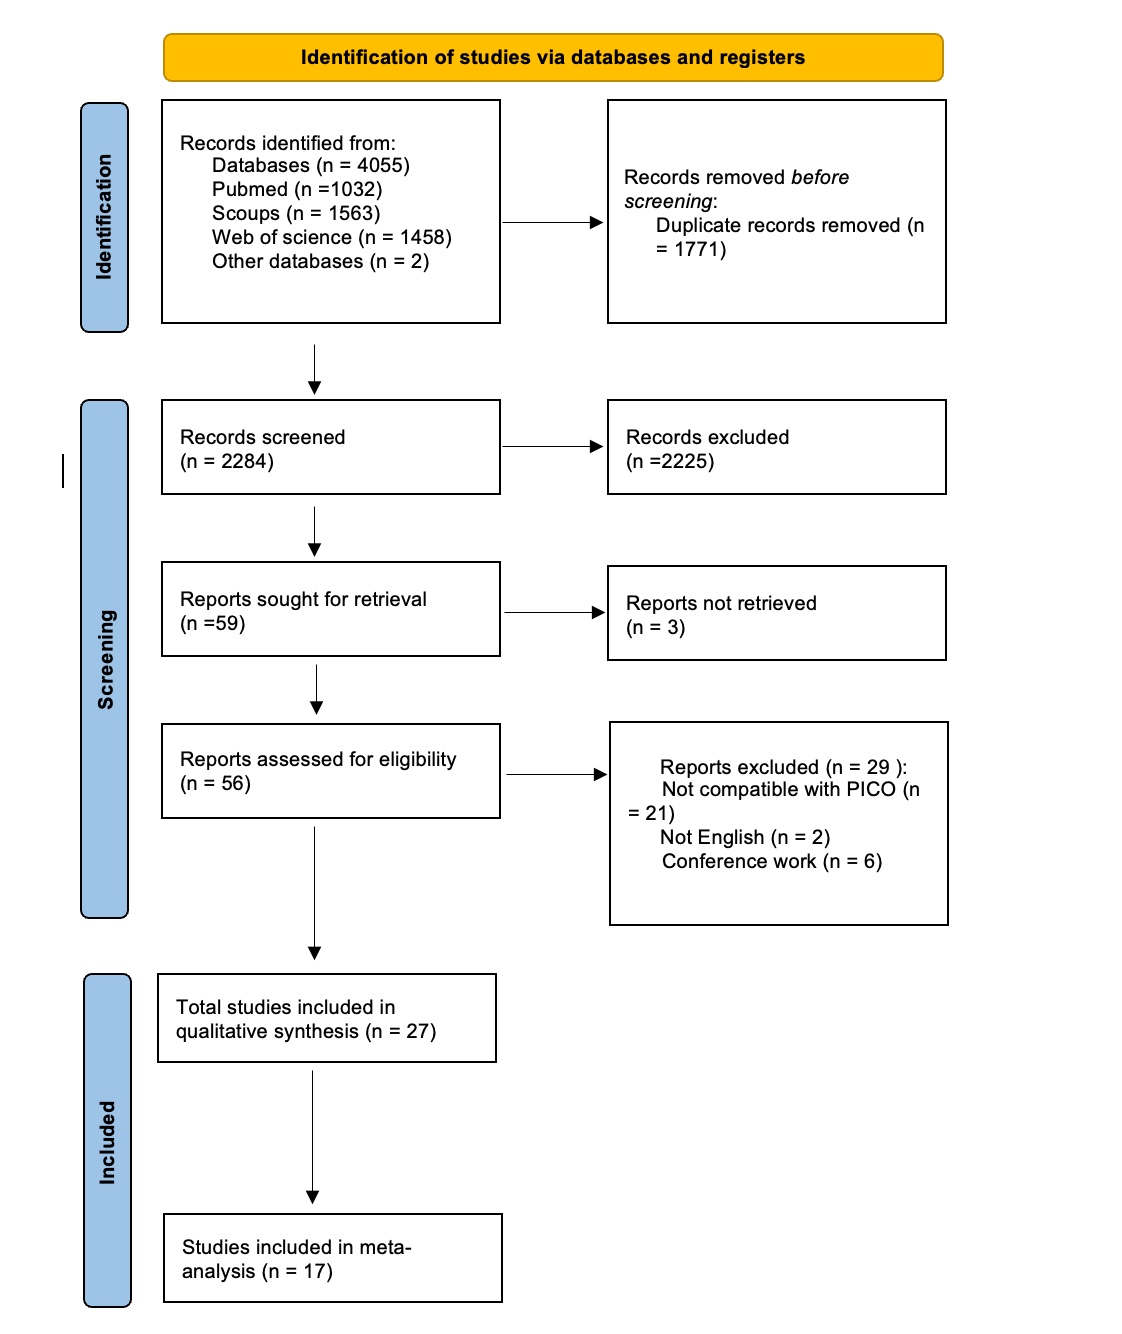 Figure (1) PRISMA Flow Chart Illustrating Search Strategy and Selection of Included Studies
.jpg) Figure (2) Diagnostic Accuracy of Ultrasound for Osteoarthritis Features.
Figure (2) Diagnostic Accuracy of Ultrasound for Osteoarthritis Features.
(A) Total KL Grade: Pooled Se: 0.94 (95% CI: 0.71–0.99); Pooled Sp: 0.79 (95% CI: 0.48–0.94).
Studies included: Uchio 2018, Mortada 2016, Brom 2020, Yanagisawa 2014, Wang 2020. SROC AUC: 0.94 (95% CI: 0.91–0.95). LR+ = 4; LR– = 0.08. Post-Test Probabilities: Post_Prob_Pos = 81%; Post_Prob_Neg = 7%.
(B) Osteophytes: Pooled Se: 0.86 (95% CI: 0.76–0.92); Pooled Sp: 0.76 (95% CI: 0.65–0.84). Studies included: Sadeghian 2018, Oyamakinde 2019, Majidi 2019, Okano 2016, Podlipská 2016, Nevalainen 2018, Catay 2012. SROC AUC: 0.87 (95% CI: 0.84–0.90). LR+ = 3; LR– = 0.18. Post-Test Probabilities: Post_Prob_Pos = 94%; Post_Prob_Neg = 46%.
(C) Cartilage Degeneration: Pooled Se: 0.88 (95% CI: 0.71–0.95); Pooled Sp: 0.76 (95% CI: 0.73–0.79). Studies included: Brom 2020, Okano 2016, Podlipská 2016, Nevalainen 2018, Saarakkala 2012, SHAABAN 2019, Catay 2012. SROC AUC: 0.79 (95% CI: 0.75–0.82). LR+ = 4; LR– = 0.16.
Post-Test Probabilities: Post_Prob_Pos = 84%; Post_Prob_Neg = 18%. Total KL grade classification demonstrated the highest diagnostic accuracy (AUC = 0.94), with near-perfect Se (0.94) and moderate Sp (0.79).
(D) MMP: Pooled Se: 0.77 (95% CI: 0.56–0.90); Pooled Sp: 0.70 (95% CI: 0.47–0.86). Studies included: Sadeghian 2018, Majidi 2019, Podlipská 2016, Nevalainen 2018, TRÄISTARU1 2013, Catay 2012. SROC AUC: 0.80 (95% CI: 0.77–0.84). LR+ = 3; LR– = 0.32. Post-Test Probabilities: Post_Prob_Pos = 80%; Post_Prob_Neg = 34%.
Osteophytes and cartilage degeneration showed strong Se (0.86–0.88) but weaker Sp (0.74–0.76). MMP-based detection had lower pooled Se (0.77) and Sp (0.70), reflecting challenges in disease progression follow up. All SROC curves indicated robust discriminative capacity (AUC >0.75), with LRs supporting clinical utility.
AUC, area under the curve; CI, confidence interval; KL, Kellgren-Lawrence; LR+, positive likelihood ratio; LR−, negative likelihood ratio; MMP, Medial Meniscal Protrusion; Post_Prob_Pos/Neg, post-test probability (positive/negative); SROC, summary receiver operating characteristic; Sp, Specificity; Se, Sensitivity.
.jpg) Figure (3) Forest Plots of Sensitivity and Specificity for US Detection of OA Severity by KL Grade (A) , (B), (C), (D), and (E): Forest Plots For KL grade 0, Se was 0.47 (95% CI: 0.12–0.85) and Sp was 0.98 (95% CI: 0.19–1.00). Studies included: Mortada 2016, Brom 2020, Wang 2020.
Figure (3) Forest Plots of Sensitivity and Specificity for US Detection of OA Severity by KL Grade (A) , (B), (C), (D), and (E): Forest Plots For KL grade 0, Se was 0.47 (95% CI: 0.12–0.85) and Sp was 0.98 (95% CI: 0.19–1.00). Studies included: Mortada 2016, Brom 2020, Wang 2020.
For KL grade 1, Se was 0.95 (95% CI: 0.53–1.00) and Sp was 0.89 (95% CI: 0.44–0.99). Studies included: Mortada 2016, Brom 2020, Wang 2020.
For KL grade 2, Se was 0.99 (95% CI: 0.69–1.00) and Sp was 0.86 (95% CI: 0.48–0.97). Studies included: Mortada 2016, Brom 2020, Wang 2020.
For KL grade 3, Se was 0.87 (95% CI: 0.82–0.91) and Sp was 0.90 (95% CI: 0.67–0.98). Studies included: Mortada 2016, Brom 2020, Wang 2020.
For KL grade 4, Se was 0.94 (95% CI: 0.84–0.98) and Sp was 0.97 (95% CI: 0.42–1.00). Studies included: Mortada 2016, Brom 2020, Wang 2020.
Se and Sp improved with higher KL grades, reaching near-perfect performance for KL4 (Se = 0.94, Sp = 0.97). KL0 exhibited the lowest pooled Se (0.47) and widest CIs, indicating variability in early-stage detection.
Abbreviations: CI, confidence interval; KL, Kellgren-Lawrence; TP, true positives; TN, true negatives; FP, false positives; FN, false negatives; Sp, Specificity; Se, Sensitivity.
To cite this abstract in AMA style:
Abdelsalam M, Hafez H, Lasheen M, Badwy B, El Sedafy O, Mahdy M, Mohammed H, Awad M. Diagnostic Test Accuracy of Ultrasound for Detecting Knee Osteoarthritis: A Systematic Review and Meta-Analysis [abstract]. Arthritis Rheumatol. 2025; 77 (suppl 9). https://acrabstracts.org/abstract/diagnostic-test-accuracy-of-ultrasound-for-detecting-knee-osteoarthritis-a-systematic-review-and-meta-analysis/. Accessed .« Back to ACR Convergence 2025
ACR Meeting Abstracts - https://acrabstracts.org/abstract/diagnostic-test-accuracy-of-ultrasound-for-detecting-knee-osteoarthritis-a-systematic-review-and-meta-analysis/