Session Information
Date: Saturday, November 12, 2022
Title: Spondyloarthritis Including PsA – Diagnosis, Manifestations, and Outcomes Poster I
Session Type: Poster Session A
Session Time: 1:00PM-3:00PM
Background/Purpose: We sought to discover novel serum biomarkers of ankylosing spondylitis (AS) for diagnosis and monitoring disease activity.
Methods: We used biologic-treatment naïve AS and healthy control (HC) patient sera from the Prospective Study of Outcome in Ankylosing Spondylitis UTHealth biorepository. We studied age, gender and race-matched patient and control sera in a 1:1:1 ratio for active, inactive, and HC for a total of 80 patients. Active disease was defined by an Ankylosing Spondylitis Disease Activity Score (ASDAS) ≥2.1 and inactive disease as ASDAS < 1.3. Serum samples were immediately stored < -70°C and not thawed for other experiments. We used the 1320 protein SOMAscan™ assay (SomaLogic; Boulder, CO), which is a sensitive, quantitative, aptameric protein biomarker discovery platform.
T-tests tests were performed for high and low-disease activity AS patients compared to health controls (Diagnosis Analysis) and high compared to low disease activity (Monitoring Analysis) in a 2:1 and 1:1 ratio, respectively. In our analyses, p-values and q-values (false discovery-rate [FDR] corrected p-value) were calculated for all proteins- a p< 0.05 were considered differentially expressed proteins (DEPs).
We used the STRING (https://string-db.org) database to analyze DEPs in our Diagnosis and Monitoring analyses for protein-protein interactions (PPI) using Cytoscape software. The Cytoscape Molecular Complex Detection (MCODE) plugin was used to find clusters in PPI networks, confidence cutoff of 0.4. Lasso regression analysis was performed of our Diagnosis DEPs to determine optimal protein combination in a 1:1 training/test set split cohort of our 80 patients in R.
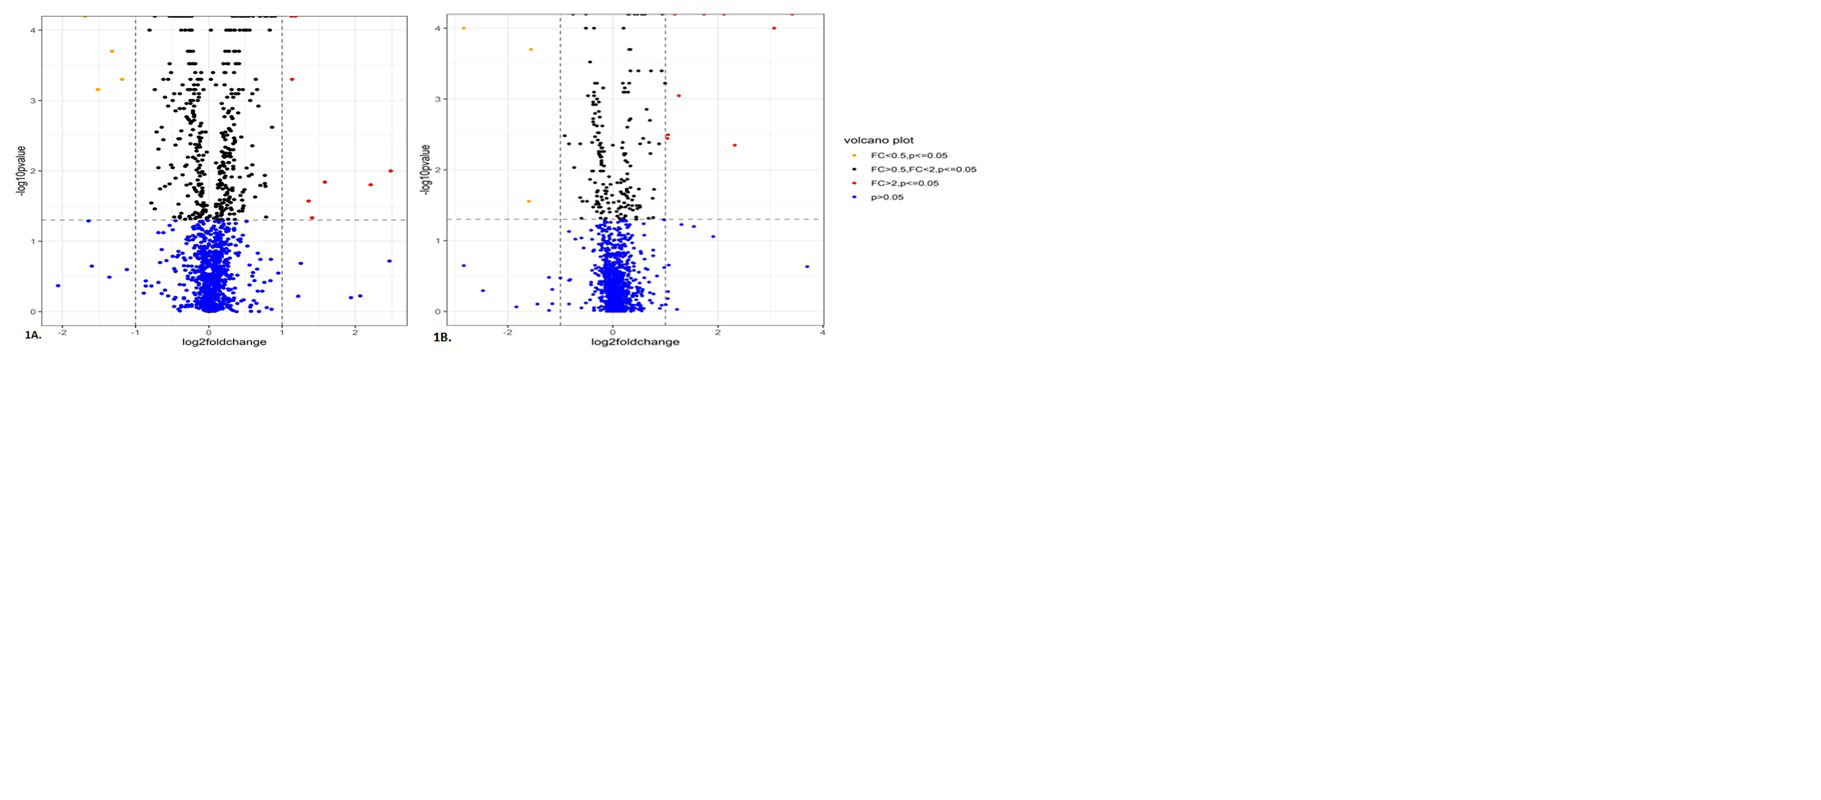
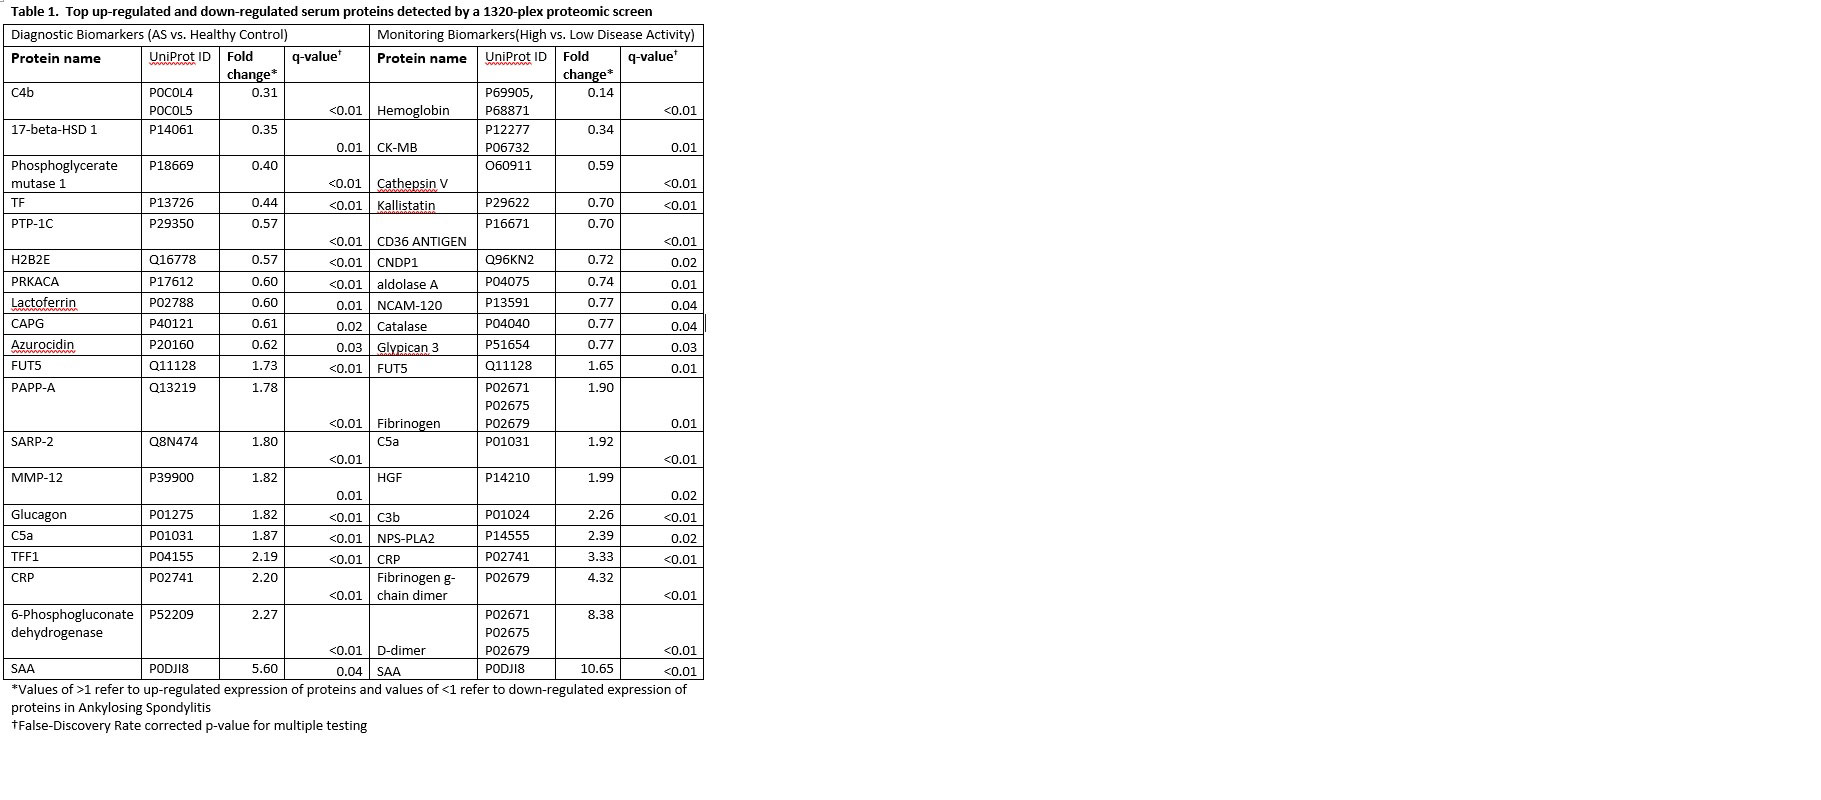
Results: Of the 1317 proteins detected in our Diagnosis and Monitoring analyses, 367 and 167 (317 and 59, FDR-corrected q< .05) DEPs were detected, respectively (Figure 1). The top 10 up-regulated and down-regulated DEPs based on fold change for diagnostic and monitoring biomarkers are presented in Table 1.
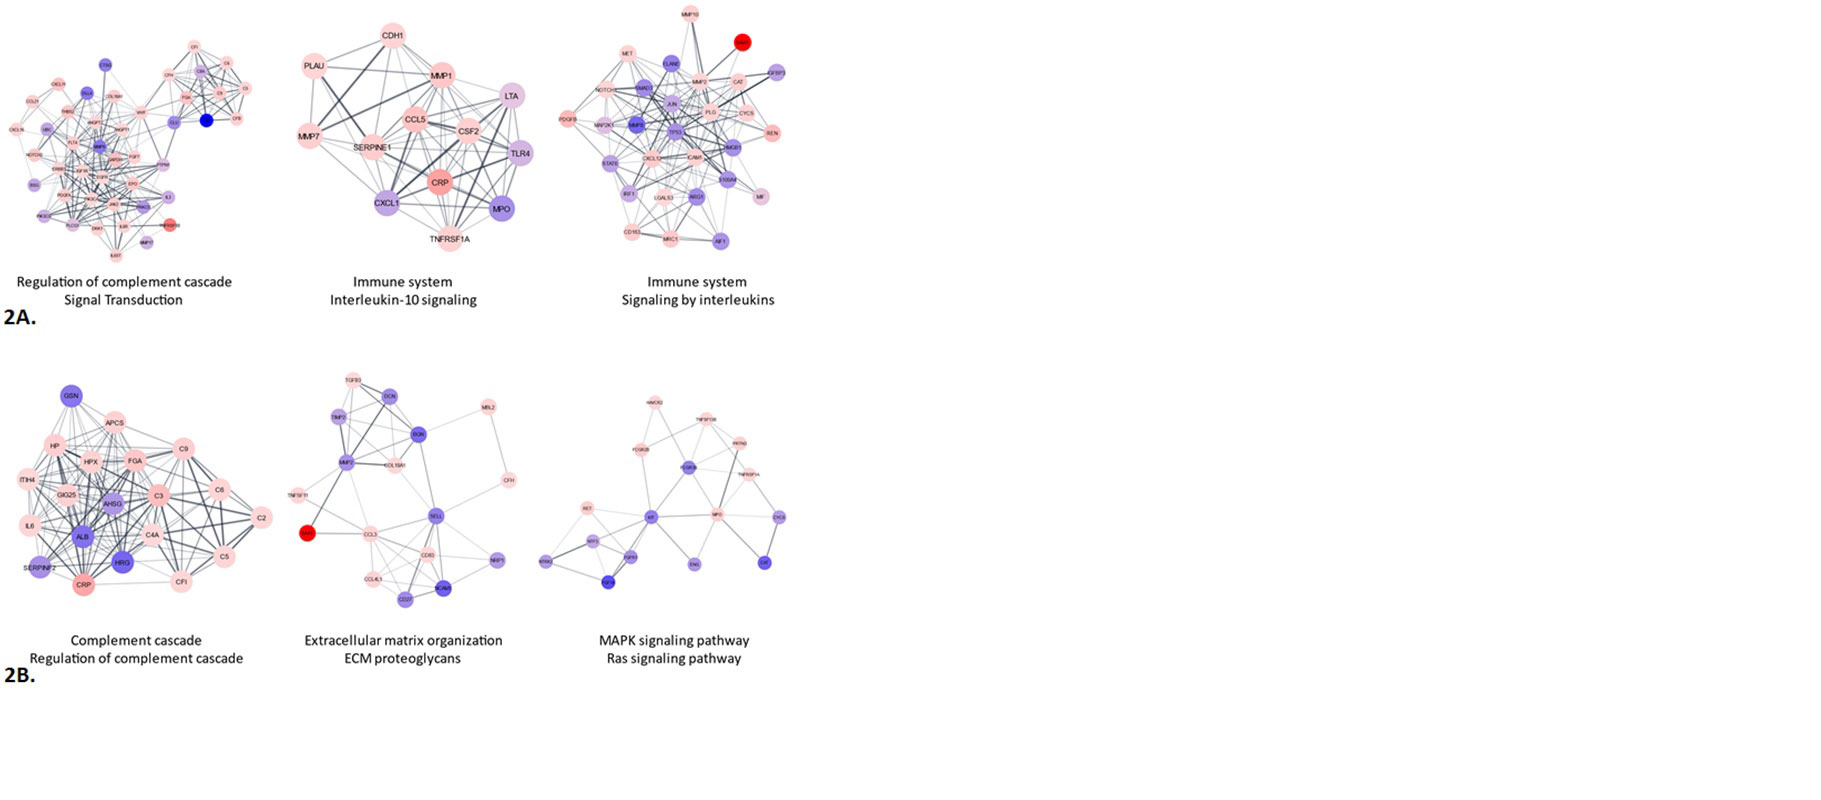
MCODE analyses identified complement regulation/signal transduction, IL-10 signaling/Immune system and Immune system/Interleukin signaling as the top 3 clusters among the diagnostic biomarkers. Complement, Extracellular matrix organization/proteoglycans and MAPK/RAS signaling were the top 3 clusters among the monitoring biomarkers (Figure 2).
Lasso regression identified a Diagnostic 13-protein model (IgA, C5a, SARP-2, SLPI, Cathepsin A, NXPH1, CXCL16, gp130, C4b, Cofilin-1, CHL1, SLAF6 and Macrophage mannose receptor) predictive of AS. This model had a sensitivity of 0.75, specificity of 0.90, a kappa of 0.59, and an overall accuracy of 0.80 (95% CI: 0.61-0.92). The predictive probability of our model to discriminate AS patients vs controls based on ROC curve (95% CI) was 0.79 (0.61-0.96).
Conclusion: We identified multiple candidate AS diagnostic and disease activity monitoring serum biomarkers using a comprehensive proteomic screen. Enrichment analysis identified key pathways in AS diagnosis and monitoring. Lasso regression identified candidate diagnostic serum biomarker panels with modest predictive ability. Further work is required to validate these findings.
To cite this abstract in AMA style:
Hwang M, Castillo J, Vanarsa k, Zheng J, Assassi S, Mohan C, Reveille J. Quantitative Proteomic Screening Uncovers Diagnostic and Monitoring Serum Biomarkers of Ankylosing Spondylitis [abstract]. Arthritis Rheumatol. 2022; 74 (suppl 9). https://acrabstracts.org/abstract/quantitative-proteomic-screening-uncovers-diagnostic-and-monitoring-serum-biomarkers-of-ankylosing-spondylitis/. Accessed .« Back to ACR Convergence 2022
ACR Meeting Abstracts - https://acrabstracts.org/abstract/quantitative-proteomic-screening-uncovers-diagnostic-and-monitoring-serum-biomarkers-of-ankylosing-spondylitis/


