Session Information
Session Type: Poster Session (Monday)
Session Time: 9:00AM-11:00AM
Background/Purpose: 3D femur bone shape measured by statistical shape modelling (SSM) provides a responsive biomarker of knee OA. However it is unclear how the 3 knee bones (femur, tibia and patella) relate to each other and whether responsiveness is only femur-specific. We assessed baseline and longitudinal relationships between the 3 knee bones and examined factors influencing these.
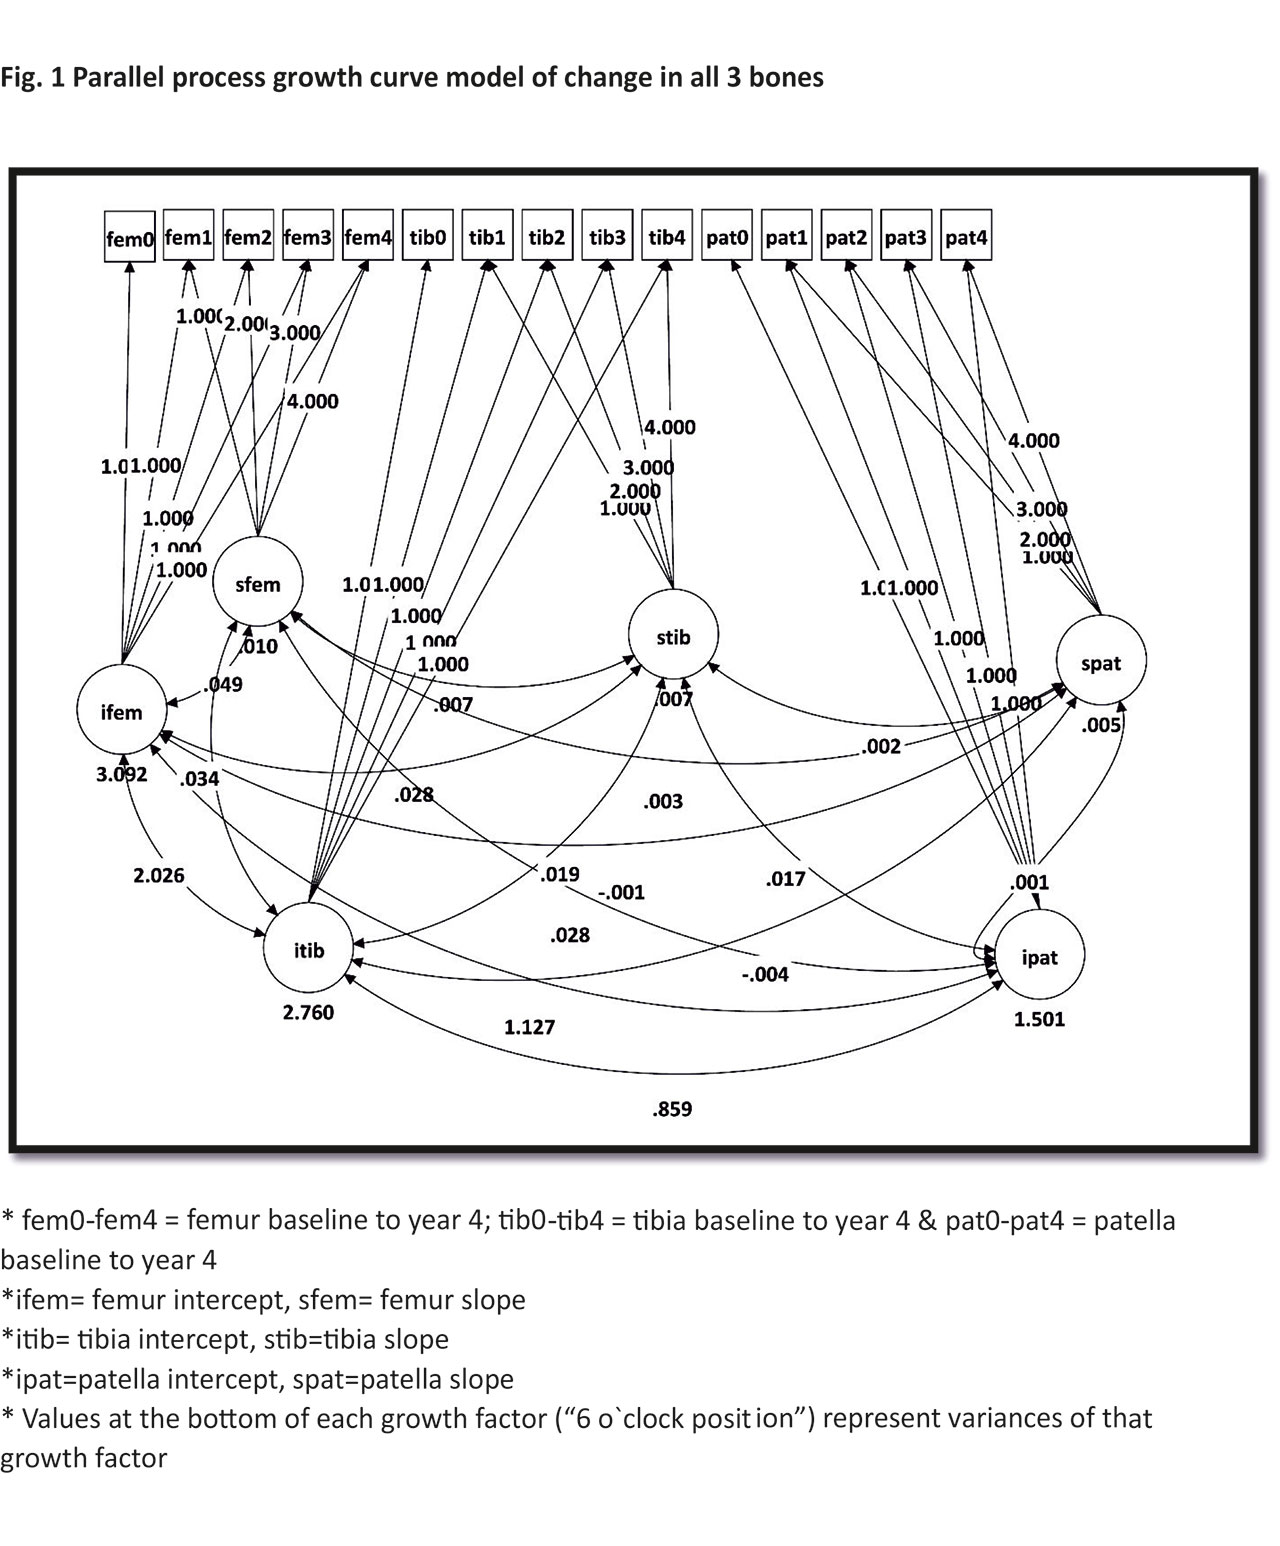
Methods: We included 4796 Osteoarthritis Initiative participants with 4 year follow up (37,583 MRIs, 5031 knees without OA at baseline). 3D bone data was computed by Imorphics (Manchester, UK) from MRIs using SSMs. Briefly, an OA vector is constructed for each bone, defined as a line passing through mean shapes of bone with and without OA, parameterised as shape components. Individual bone shapes are projected orthogonally onto this vector. Zero is defined as the mean position along the vector in those with a KL score of 0 for 4 consecutive years (Non-OA group); +1 unit is 1SD of the Non-OA group. Analyses were stratified by gender, independently for each bone. Correlation analysis was performed between bones. Next, bones classed as “OA” (bones falling above the 95th percentile of the Non-OA group) were described for all possible combinations using proportions. Latent Growth Curve Modelling (Mplus) identified growth patterns for each bone. After establishing the best-fitting models we tested the effect of covariates (age, weight, ethnicity, pain and history of knee surgery) on intercept and slope. Lastly parallel process growth models were fitted by modelling growth in all bones using one model, allowing each bone to co-vary.
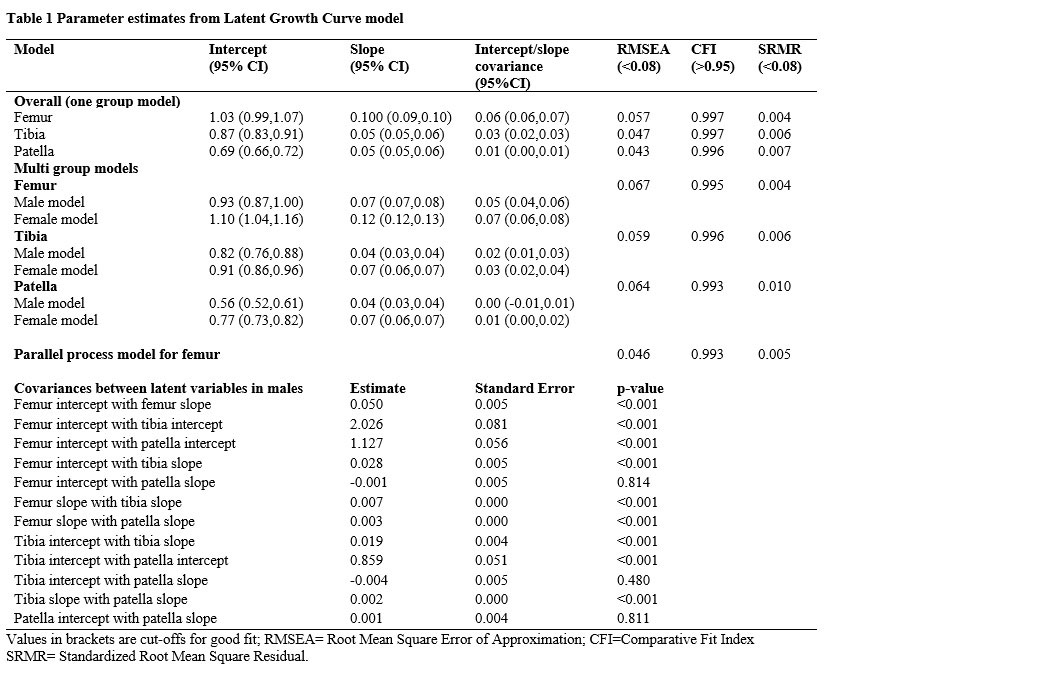
Results: Positive correlation was seen between bones (femur vs tibia, r=0.68; femur vs patella, r=0.55& tibia vs patella, r =0.45). In the 3775 OA knees, 25% had all 3 bones classed as OA, 19% exclusively femur, 15% tibia, 11% patella and 20% had femur+tibia. Linear growth models showed excellent fit to the data (Table 1).Greatest rate of change, representing worsening was seen in femur (slope ~ 0.10). Increase in femur was 0.06 units/unit of baseline femur (Table 1). Rate of change in females was twice that of males. Age had no effect, but ethnicity particularly in females influenced all bones (lower intercepts in Caucasians). Ethnicity was also associated with slopes in both femur and tibia in females (Table 2). Only weight in females was associated with patella slope. Knee pain and body weight explained most intercept and slope variance (Table 2), prior knee surgery influenced baseline scores but explained little variance. Interrelationships between all 3 bones in their disease starting points and rates of change were statistically significant (Table 1, Figure 1).
Conclusion: There was positive correlation between the 3 bones, stronger between femur and tibia. All bones changed linearly; rate of change of femur twice that of tibia and patella and the rate in females twice that of males. Level of baseline disease, body weight and pain were important determinants of change, with similar effects on femur and tibia. Effects on patella were small, possibly due to difficulty in measuring this small bone. It therefore seems likely that the femur, tibia and patella bones are part of a single disease process, with the femur providing the greatest change.
To cite this abstract in AMA style:
Dube B, Bowes M, Hensor E, Kingsbury S, Conaghan P. What Is the Relationship Between the 3 Knee Bones in Osteoarthritis? Baseline and Longitudinal Associations Using a Latent Growth Modelling Approach on 37,583 MR Images from the Osteoarthritis Initiative [abstract]. Arthritis Rheumatol. 2019; 71 (suppl 10). https://acrabstracts.org/abstract/what-is-the-relationship-between-the-3-knee-bones-in-osteoarthritis-baseline-and-longitudinal-associations-using-a-latent-growth-modelling-approach-on-37583-mr-images-from-the-osteoarthritis-initiat/. Accessed .« Back to 2019 ACR/ARP Annual Meeting
ACR Meeting Abstracts - https://acrabstracts.org/abstract/what-is-the-relationship-between-the-3-knee-bones-in-osteoarthritis-baseline-and-longitudinal-associations-using-a-latent-growth-modelling-approach-on-37583-mr-images-from-the-osteoarthritis-initiat/


