Session Information
Session Type: Poster Session C
Session Time: 10:30AM-12:30PM
Background/Purpose: Trabecular bone has been increasingly recognized as being important in the pathogenesis of OA. Although an earlier study has shown that medial trabecular bone texture (TBT) predicted OA progression, the predictive validity of medial and lateral TBT regions as structural biomarkers for radiographic and pain progression at different stages of radiographic knee OA is not clear. Therefore, we investigated the predictive validity of longitudinal compartmental changes in TBT at different KL stages, as these have important implications for prognosis and treatment.
Methods: We used data from the FNIH OAI sub-study of 600 participants selected based on their 48-month progression status: Group 1: radiographic and pain, Group 2: radiographic-only, Group 3: pain-only, Group 4: non-progressors. Regions of interest (ROIs) were defined with anatomical landmarks based on an automated delineation of the tibial plateau as shown in Figure 1. The inter-edge tibial plateau distance (D) was used to consistently define ROI size and placement in each compartment. For each knee image, an augmented variance orientation method was applied to the ROIs. For each region, the mean (FDMEAN), vertical (FDV) and horizontal (FDH) fractal dimensions were calculated. The FDMEAN was the average of FDs in all directions. Minor axis FD (FDSta) was also calculated, quantifying texture roughness in the direction of the roughest part of trabecular bone, which contains the shortest bone length components. Higher values of FDs indicate rougher texture, i.e., more complex and irregular bone architecture. TBT assessments were performed at the baseline and 24-month time points. Multiple logistic regression models were used to examine the associations between pain and/or radiographic progression and baseline to 24-month changes in FDs stratified by Kellgren-Lawrence grade (KLG) 2 and 3 and by compartment. The models were adjusted for baseline age, sex, race, BMI, WOMAC pain, pixel spacing and ROI size.
Results: The demographic characteristics and the significant results are summarized in Tables 1 and 2, with the roughest FDs identified as the strongest predictors of combined pain and radiographic progressor status. The associations were most evident between radiographic and pain progressors (Group 1) vs. non-progressors (Group 4) and vs. all other comparators (Groups 2, 3 and 4) for both the medial and lateral compartments at KLG2. The mean and roughest FDs were identified as the predictors of pain progressor status (1, 3 vs. 2, 4) and the roughest FD was identified as the predictor of any OA progressor status (1, 2, 3 vs. 4) for the lateral compartment at KLG2. The vertical and horizontal FDs were identified as predictors that differentiate structural progression without pain from pain progression without structural change (2 vs. 3) for the lateral compartment at KLG3.
Conclusion: The risk of radiographic OA and pain progression increases with increasing medial trabecular bone texture roughness in knee joints; the risk of radiographic OA and pain progression with lateral roughness is variable. Our results suggest that fractal bone texture analysis may serve as a potential biomarker for risk prediction for structural and symptomatic knee OA progression.
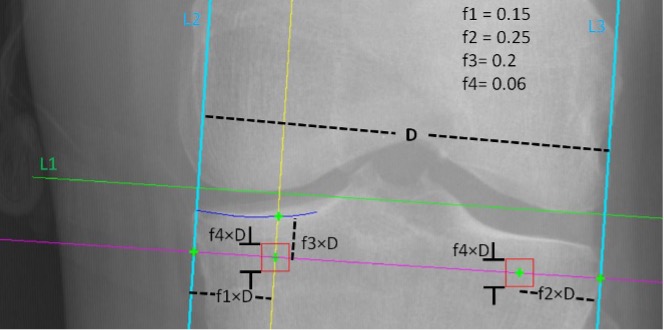 Figure 1. Coordinate system for ROI (red square) positioning
The system is flexible in that f1, f2, f3 and f4 are arbitrary distances that can be adjusted automatically once D, L1, L2 and L3 are placed.
L1 (green line) = line parallel to the inferior edge of the femoral condyles
L2 (left blue line) = line parallel to the medial edge of the tibial plateau
L2 (right blue line) = line parallel to the lateral edge of the tibial plateau
D (black dotted line) = distance between L2 and L3 and used as a constant to place the region of interest (ROI)
f1 = proportion used to place the medial tibial ROI from the medial edge of the tibial plateau
f2 = proportion used to place the lateral tibial ROI from the lateral edge of the tibial plateau
f3 = proportion used to place the ROI inferior to the rim of the tibial plateau
f4 = proportion used to determine the size of the ROI
red square = region of interest (ROI) defined as squares with side length of f4×D
.jpg) * radiographic and pain progressors
* radiographic and pain progressors
† radiographic-only progressors
‡ pain-only progressors
**non-progressors
.jpg) L = lateral; M = medial; FDSta = roughest fractal dimension; FD mean = the average of the fractal dimensions in all directions : FDV = vertical fractal dimension; FDH = horizontal fractal dimension. Higher fractal dimension indicates rougher bone texture (i.e. more complex and irregular bone architecture). ORadj = odds ratio adjusted for baseline age, sex, race, BMI, WOMAC pain, pixel spacing and ROI size; 95% CI = 95% confidence interval. ORs are based on every 0.01 increase in the fractal dimension.
L = lateral; M = medial; FDSta = roughest fractal dimension; FD mean = the average of the fractal dimensions in all directions : FDV = vertical fractal dimension; FDH = horizontal fractal dimension. Higher fractal dimension indicates rougher bone texture (i.e. more complex and irregular bone architecture). ORadj = odds ratio adjusted for baseline age, sex, race, BMI, WOMAC pain, pixel spacing and ROI size; 95% CI = 95% confidence interval. ORs are based on every 0.01 increase in the fractal dimension.
To cite this abstract in AMA style:
Podsiadlo P, Kwoh C, Wolski M, Crawmer J, Tang R, Liu S, Sun X, Neogi T, Nelson A, Liew J, Duryea J. Trabecular Bone Texture is Associated with Structural and Pain Progression in Later Stages of Knee Osteoarthritis: Longitudinal Data from the FNIH OAI Cohort [abstract]. Arthritis Rheumatol. 2025; 77 (suppl 9). https://acrabstracts.org/abstract/trabecular-bone-texture-is-associated-with-structural-and-pain-progression-in-later-stages-of-knee-osteoarthritis-longitudinal-data-from-the-fnih-oai-cohort/. Accessed .« Back to ACR Convergence 2025
ACR Meeting Abstracts - https://acrabstracts.org/abstract/trabecular-bone-texture-is-associated-with-structural-and-pain-progression-in-later-stages-of-knee-osteoarthritis-longitudinal-data-from-the-fnih-oai-cohort/