Session Information
Session Type: Poster Session C
Session Time: 10:30AM-12:30PM
Background/Purpose: Juvenile dermatomyositis (JDM) is the most common idiopathic inflammatory myopathy in children. JDM often presents with rash, and skin inflammation is more refractory to treatment compared to muscle inflammation. Treatments are limited due to incomplete understanding of disease pathogenesis, including under-explored analysis of the cellular composition of lesional skin, exacerbated by a lack of access to pediatric tissue. Therefore, we assembled a cohort of archival JDM skin biopsies and performed single-nuclei RNA-sequencing for an unbiased analysis of skin-specific cellular and transcriptomic drivers of JDM.
Methods: Single nuclei RNA was isolated from formalin-fixed paraffin-embedded (FFPE) skin biopsies using the 10X Genomics Flex platform; the cohort included patients with JDM (n=12) and controls (CTL, n=4). All JDM patients met 2017 EULAR/ACR classification criteria, and 11/12 were treatment-naïve at sampling. We used SoupX to remove ambient RNA, and DoubletFinder to remove doublets. We performed UMAP dimensionality reduction and Louvain clustering with Seurat. Cell clusters were annotated using published cell type-specific marker genes. Analysis of differentially expressed genes (DEG) was performed using Model-based Analysis of Single-cell Transcriptomics. Cell type abundance between JDM and CTL was analyzed with Milo and the Wilcoxon rank sum test. Gene set scores were calculated using the Seurat AddModuleScore() function. Given clinical differences between skin and muscle inflammation in JDM, we compared our skin data to a single-nuclear RNA-sequencing dataset from JDM (n=6) and control (n=7) muscle biopsy samples.
Results: From the 91,216 cells analyzed, we identified 14 major cell types (Fig 1a,b) and 20 unique cell clusters (Fig 1c). JDM samples showed increased abundance of immune cells compared to CTL (Fig 2a,b). Analysis of cellular neighborhoods also identified subsets of neighborhoods with consistently higher abundance of JDM in immune cell types (Fig 2c,d). Keratinocytes, melanocytes, endothelial cells, and macrophages showed the highest number of differentially expressed genes (Fig 3a). In all skin cell types, JDM samples had higher average expression of Interferon (IFN)-response genes (IRG) compared to CTL (Fig 3b). Endothelial cells showed the highest median IRG set expression in both JDM skin (Fib 3b) and muscle (Fig 3c), with many IRG demonstrating differential expression in both skin and muscle endothelial cells (Fig 3d,e).
Conclusion: Single cell skin transcriptomics in JDM highlights dysregulated immune and endothelial cell populations contributing to disease pathogenesis. Altered IFN is a hallmark of JDM skin tissue, with macrophages, melanocytes, and endothelial cells exhibiting the highest levels of IRG expression. While all cell types show high IRG expression in JDM, endothelial cells exhibit the highest median IRG expression in both muscle and skin. This unique single-cell atlas of JDM skin will generate critical hypotheses for investigating cellular mechanisms of JDM rash and vasculopathy and for identifying targeted therapies.
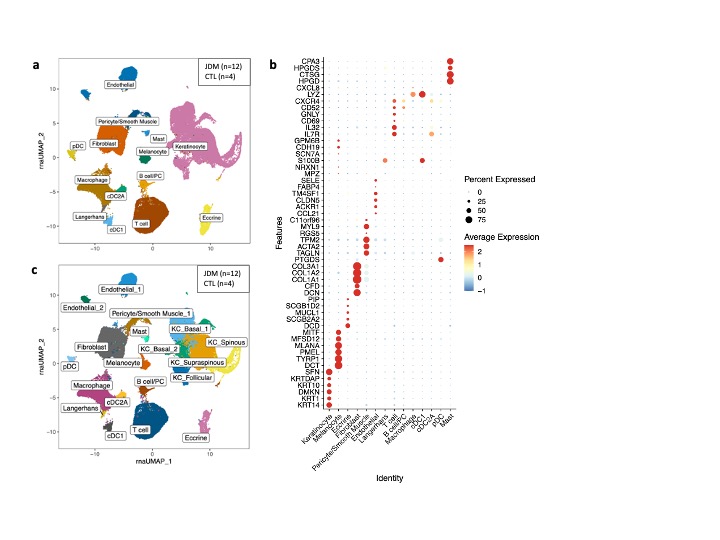 Fig 1. Single cell transcriptomics of JDM skin identifies keratinocyte, endothelial, and immune cell populations. a) UMAP plot colored by cell type. b) UMAP plot colored by cell cluster fine annotation. c) Dot plot of expression for cell type marker genes.
.jpg) Fig 2. Immune cell clusters and neighborhoods show high abundance of cells from JDM samples. a,b) Boxplots representing the fraction (a) and number (b) of cells that come from immune cell types among all JDM or CTL cells; p-value from Wilcoxon rank-sum test. c) Neighborhood graph from Milo showing log2(fold change) of cell abundance of JDM vs CTL within a neighborhood of cells. Each node is a neighborhood of cells, with edges indicating cells in common between two neighborhoods. Graph layout reflects the position of each neighborhood’s index cell within the UMAP embedding in 1a. d) Right panel) Beeswarm Milo plots showing distribution of log2(fold change) of cell abundance in neighborhoods, grouped by the majority cell type within a neighborhood (>70% of cells). Left panel) Boxplots representing the fraction of cells that come from each cell type among all JDM or CTL cells; + indicates p-value < 0.05 from Wilcoxon rank-sum test, * indicates FDR < 0.05 after Benjamini-Hochberg.
Fig 2. Immune cell clusters and neighborhoods show high abundance of cells from JDM samples. a,b) Boxplots representing the fraction (a) and number (b) of cells that come from immune cell types among all JDM or CTL cells; p-value from Wilcoxon rank-sum test. c) Neighborhood graph from Milo showing log2(fold change) of cell abundance of JDM vs CTL within a neighborhood of cells. Each node is a neighborhood of cells, with edges indicating cells in common between two neighborhoods. Graph layout reflects the position of each neighborhood’s index cell within the UMAP embedding in 1a. d) Right panel) Beeswarm Milo plots showing distribution of log2(fold change) of cell abundance in neighborhoods, grouped by the majority cell type within a neighborhood (>70% of cells). Left panel) Boxplots representing the fraction of cells that come from each cell type among all JDM or CTL cells; + indicates p-value < 0.05 from Wilcoxon rank-sum test, * indicates FDR < 0.05 after Benjamini-Hochberg.
.jpg) Fig 3. Endothelial cells exhibit high differential expression of IFN-response genes in both muscle and skin JDM samples. a) Number of differentially expressed genes (DEG) in each cell type that show increased expression in JDM or CTL. b,c) IRG score for b) skin samples and c) an outside muscle biopsy single-nuclei RNA-seq dataset. Scores are calculated using 28 IRG from Kim et al 2018. Dots indicate the median IRG score across all cells in a cell type from CTL samples (X-axis) and JDM samples (Y-axis); lines indicate interquartile range. d) Scatterplot comparing the log2(fold change) values of DEG analysis in muscle (X-axis) and skin (Y-axis); DEG criteria is FDR < 0.05, absolute(log2(fold change)) >0.1. e) Venn diagram comparing DEG in outside muscle data set and skin JDM atlas.
Fig 3. Endothelial cells exhibit high differential expression of IFN-response genes in both muscle and skin JDM samples. a) Number of differentially expressed genes (DEG) in each cell type that show increased expression in JDM or CTL. b,c) IRG score for b) skin samples and c) an outside muscle biopsy single-nuclei RNA-seq dataset. Scores are calculated using 28 IRG from Kim et al 2018. Dots indicate the median IRG score across all cells in a cell type from CTL samples (X-axis) and JDM samples (Y-axis); lines indicate interquartile range. d) Scatterplot comparing the log2(fold change) values of DEG analysis in muscle (X-axis) and skin (Y-axis); DEG criteria is FDR < 0.05, absolute(log2(fold change)) >0.1. e) Venn diagram comparing DEG in outside muscle data set and skin JDM atlas.
To cite this abstract in AMA style:
Madubata C, Neely J, Goudsmit C, Berthier C, Zheng Z, Matossian S, Dvergsten J, Heaton A, Kahlenberg J, Fragiadakis G, Turnier J. Single-Cell RNA-Transcriptomics of JDM Skin Identifies JDM-Associated Immune Cell Populations and Dysregulated Interferon Signaling in Immune and Endothelial Cells [abstract]. Arthritis Rheumatol. 2025; 77 (suppl 9). https://acrabstracts.org/abstract/single-cell-rna-transcriptomics-of-jdm-skin-identifies-jdm-associated-immune-cell-populations-and-dysregulated-interferon-signaling-in-immune-and-endothelial-cells/. Accessed .« Back to ACR Convergence 2025
ACR Meeting Abstracts - https://acrabstracts.org/abstract/single-cell-rna-transcriptomics-of-jdm-skin-identifies-jdm-associated-immune-cell-populations-and-dysregulated-interferon-signaling-in-immune-and-endothelial-cells/