Session Information
Date: Tuesday, October 28, 2025
Title: (1830–1854) Systemic Lupus Erythematosus – Etiology and Pathogenesis Poster
Session Type: Poster Session C
Session Time: 10:30AM-12:30PM
Background/Purpose: SAP is an adaptor protein that mediates signaling downstream of SLAMF T cell receptors. SAP deficiency results in X-linked Lymphoproliferative immunodeficiency characterized by impaired TCR-mediated induction of GATA-3 and IL4 production, absence of mature germinal centers and loss of T cell-dependent B cell maturation. mature germinal centers, and loss of T cell-dependent B cell maturation. Our earlier research revealed elevated SAP levels in lupus and established a link between the proliferation of SAP-expressing T helper cells and lupus nephritis (LN). In this abstract, we reveal the mechanistic role of these SAP+ T cells in driving the inflammatory response associated with LN.
Methods: We enrolled lupus patients who had not previously been analyzed for SAP expression. We performed extra- and intra-cellular immunophenotyping of PBMCs using a CYTEK Aurora 35-color flow cytometry panel. PBMCs were isolated and stored in liquid nitrogen. All samples were analyzed at the same time to minimize batch effect bias. Data was analyzed in GraphPad Prism 8.4.3.
Results: 13 patients with SLE (mean age 36±13, 85% female, median SLEDAI-2K score 6 [IQR 2-7]) and 4 age and gender matched controls (age 35±7, 75% female) were included. Figure 1A shows a higher frequency of SAP+ T cells in SLE patients with a SLEDAI of ≥6 compared to controls (44% vs 27%, Mann-Whitney U test, p=0.042). SAP expression differentiates T cell maturation subsets, especially in CD4+ T cells, where SAP+ cells were more likely to be central and effector memory subsets and less likely to be naïve (Fig. 1C, 2-way ANOVA p< 0.001). Figure 2A (top panel) shows that in CD4 T cells, SAP expression is associated with polarization away from T regulatory (Treg) (CD127lowCD25hi) and T follicular helper (TFH) (CXCR5+) lineages and instead associates with increased TH2 differentiation (CCR4+CCR6-CD161-CXCR3-). A smaller but still significant increase in TH1 (CCR4-CCR6-CD161-CXCR3+) and TH17 (CD161+) subsets was also seen among the SAP+ vs. SAP- CD4 T cells. Figure 2A (bottom panel) shows increased GATA3 transcription factor expression in SAP+ CD4 T cells, further supporting predisposition to TH2 differentiation in these cells. On the other hand, Figure 2B shows that in CD8 T cells, SAP expression is associated with an increase in CCR4-CXCR+ subset and T-Bet transcription factor expression, consistent with a Th1-like CD8 T cell (TC1). Increased HLADR and granzyme B expression in SAP+ CD8 T cells suggests an activated, cytotoxic effector phenotype.
Conclusion: T cell SAP levels are elevated in SLE and are linked to disease severity. Mechanistically, we demonstrate that SAP expression correlates with T cell maturation and differentiation into pro-inflammatory effector subsets. This is significant because a better understanding of signaling downstream of SAP activation can reveal novel targetable pathways in SLE pathogenesis.
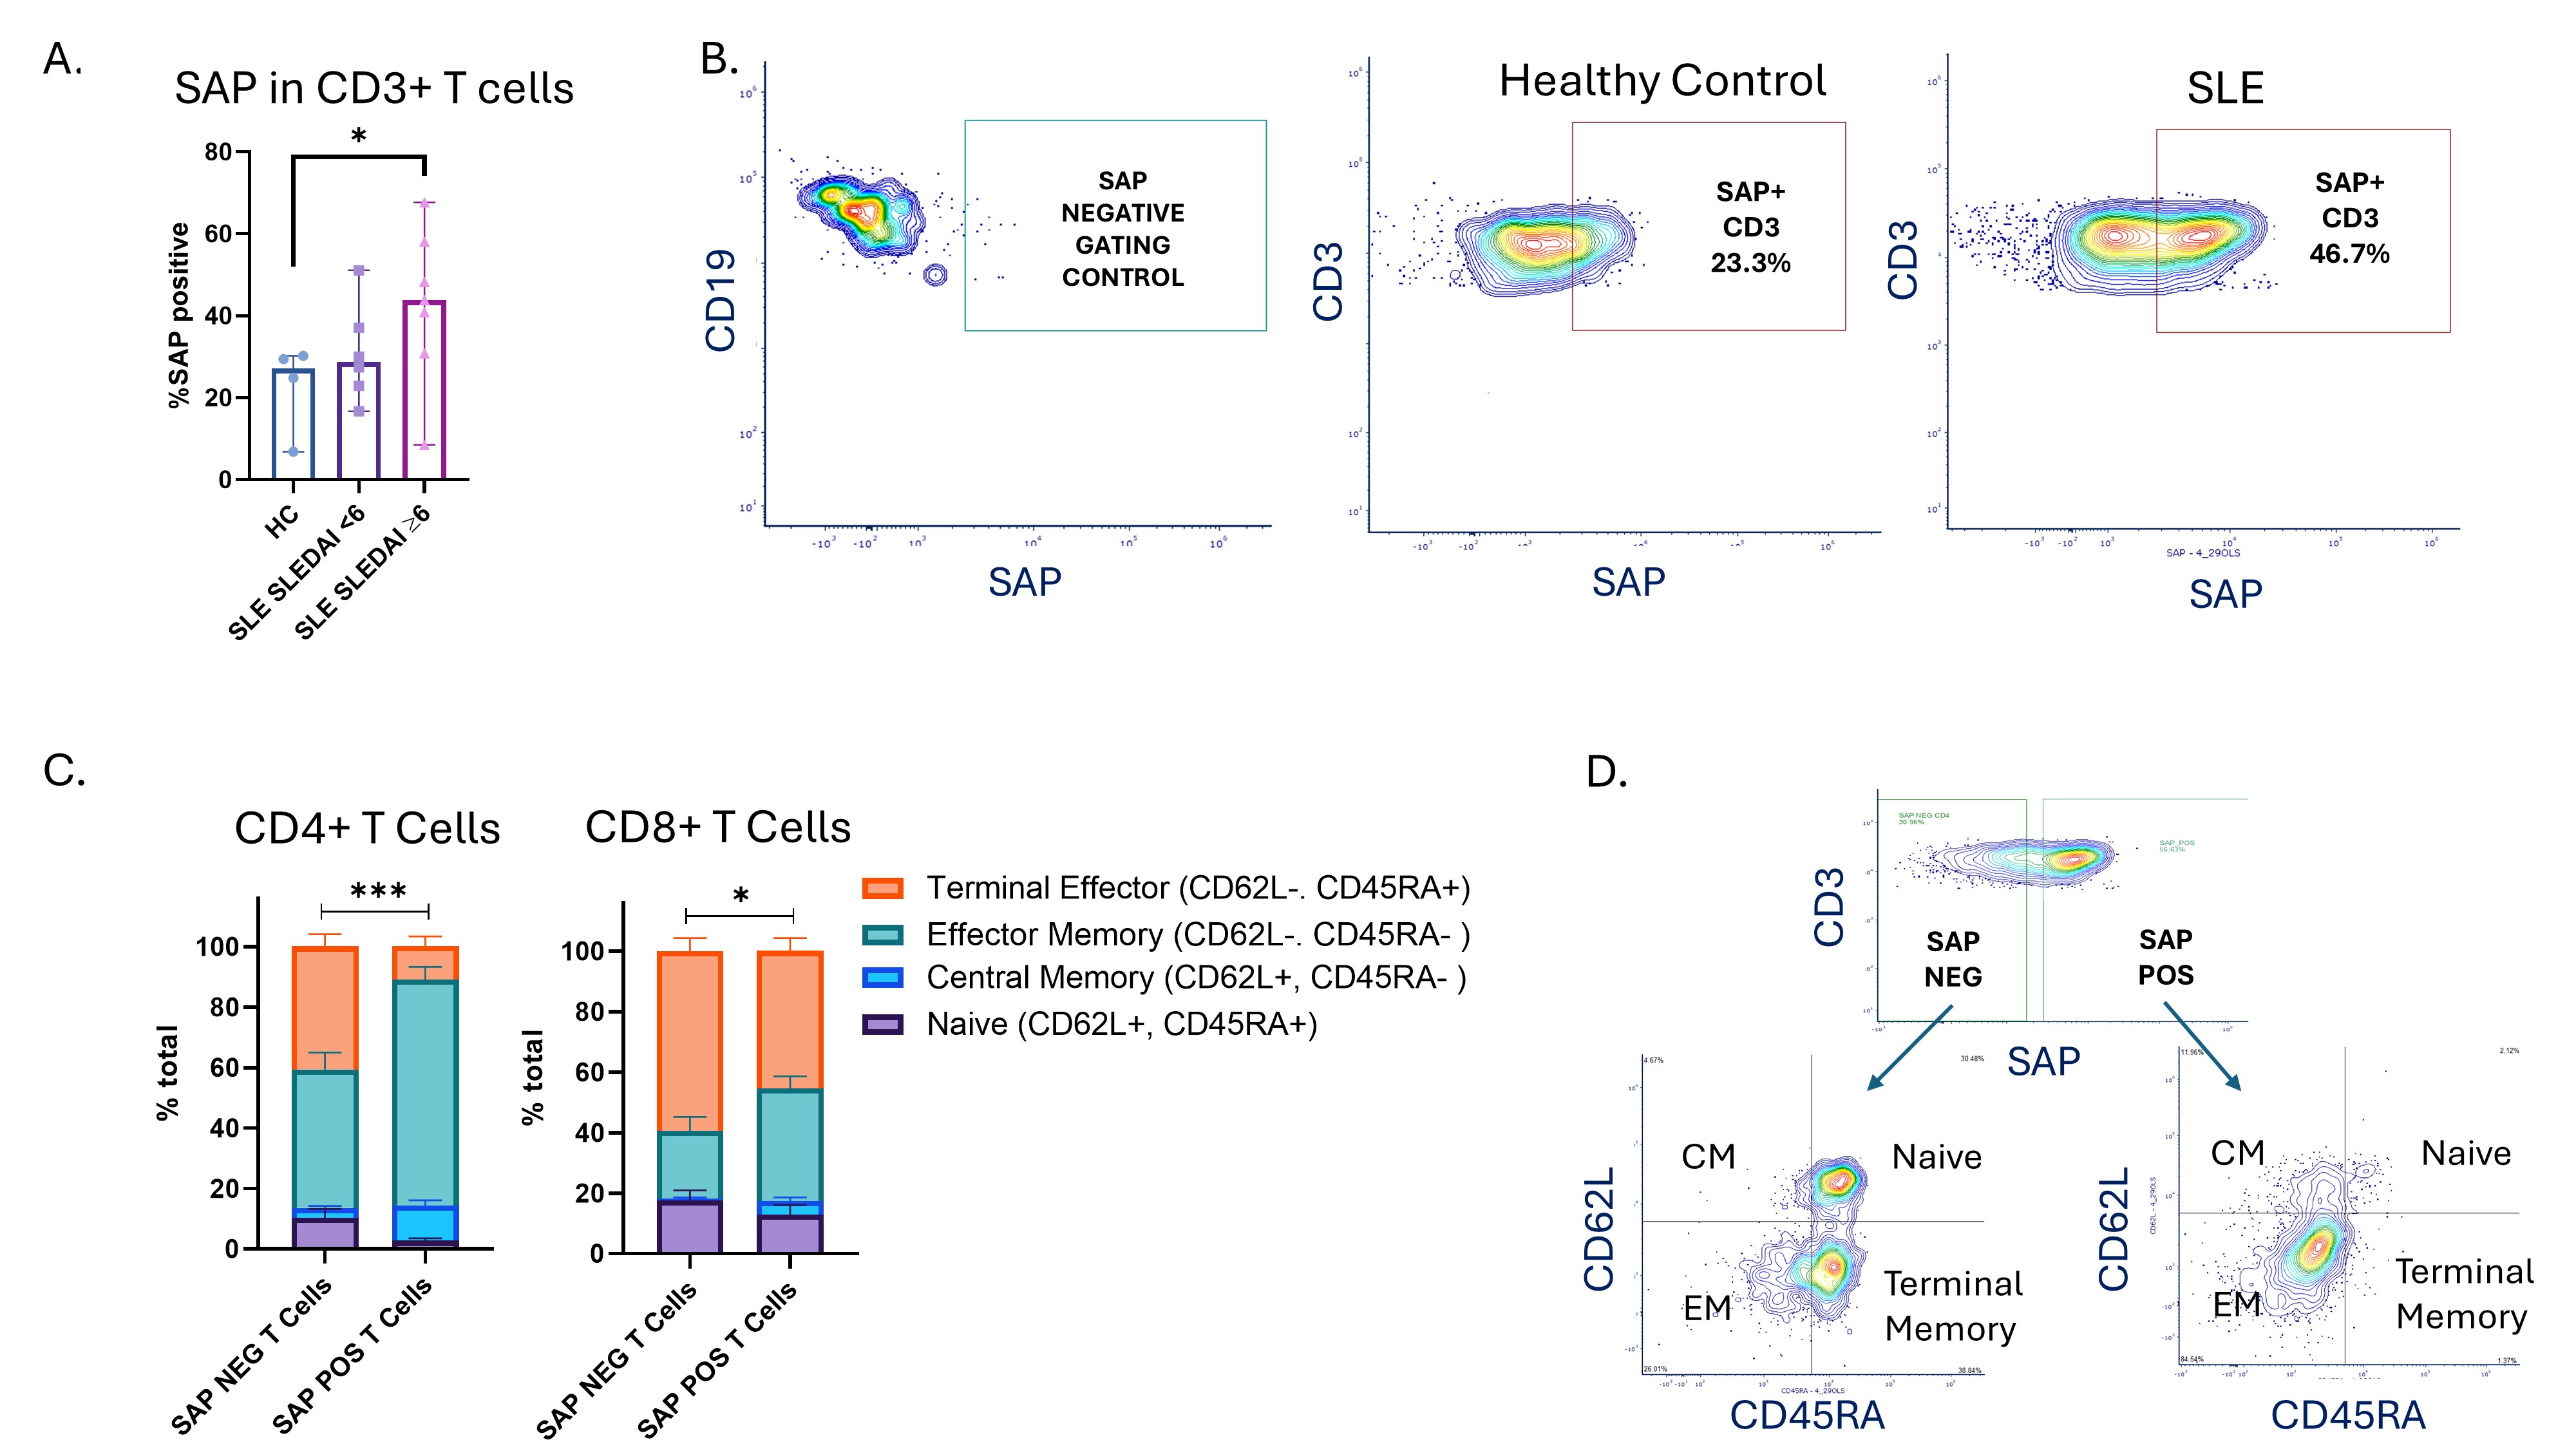 Figure 1. SAP expression is increased in effector T cells isolated from SLE patients. A. PBMCs from 13 patients with SLE (SLEDAI-2K < 6 in Nf6, SLEDAI-2K≥6 in Nf7) and healthy controls (HC, Nf4), were analyzed by flow cytometry. The frequency of SAP positive T cells is shown. B) An example of differential SAP expression between a healthy control and a patient with SLE. Gate selection was based on B cells, which do not express SAP. C) T cell maturation subsets were defined by cell surface expression of CD62L and CD45RA. In CD4 T cells (left) and CD8 T cells (right) the association of SAP expression with the distribution of maturation subsets was assessed. The stacked bars represent total population of SAP negative (SAP NEG) vs. SAP positive (SAP POS) cells from 13 patients with SLE, with the proportion of maturation subsets shown as purple (naïve cells), blue (central memory, CM), turquoise (effector memory, EM) and orange (terminal effectors). A 2-way ANOVA was used to compare subset distributions between SAP negative vs. SAP positive cells. (D) An example of T cell subset distribution comparing SAP negative to SAP positive T cells isolated from the same patient.
.jpg) Figure 2. SAP Positive T Cells are polarized towards differentiated TH2, TH1 and TH17 subsets. A. (Top Panel) CD4+ T cell subsets were defined based on cell surface expression markers and further stratified by SAP expression (POS vs. NEG). Every paired line is a unique patient sample. (Bottom Panel) Expression of transcription factors was quantified using intracellular flow cytometry and stratified by SAP expression (negative, intermediate, high). Mean ± S.D is shown. B. (Top and Bottom Panels) CD8+ T cells subsets were defined using the same method as in 2A. A t-test with p-value adjusted using the Benjamini and Hochberg correction for multiple comparisons was used. * p < 0.05, ** p < 0.01, **** p < 0.0001.
Figure 2. SAP Positive T Cells are polarized towards differentiated TH2, TH1 and TH17 subsets. A. (Top Panel) CD4+ T cell subsets were defined based on cell surface expression markers and further stratified by SAP expression (POS vs. NEG). Every paired line is a unique patient sample. (Bottom Panel) Expression of transcription factors was quantified using intracellular flow cytometry and stratified by SAP expression (negative, intermediate, high). Mean ± S.D is shown. B. (Top and Bottom Panels) CD8+ T cells subsets were defined using the same method as in 2A. A t-test with p-value adjusted using the Benjamini and Hochberg correction for multiple comparisons was used. * p < 0.05, ** p < 0.01, **** p < 0.0001.
To cite this abstract in AMA style:
Gartshteyn Y, Portnoy D, Paiola M, Askanase A, Mor A. SAP Expression in SLE T Cells is Associated with Differentiation Towards Pro-Inflammatory Effector Subsets. [abstract]. Arthritis Rheumatol. 2025; 77 (suppl 9). https://acrabstracts.org/abstract/sap-expression-in-sle-t-cells-is-associated-with-differentiation-towards-pro-inflammatory-effector-subsets/. Accessed .« Back to ACR Convergence 2025
ACR Meeting Abstracts - https://acrabstracts.org/abstract/sap-expression-in-sle-t-cells-is-associated-with-differentiation-towards-pro-inflammatory-effector-subsets/