Session Information
Session Type: Poster Session A
Session Time: 10:30AM-12:30PM
Background/Purpose: Osteoarthritis (OA) is the most common joint disease, that leads to significant pain and affects quality of life, particularly in older adults. Current treatments primarily focus on symptom relief, as no treatment has yet demonstrated the ability to modify disease progression or restore damaged joint structures. Colchicine, a medication traditionally used to treat gout, has attracted interest as a potential therapy for OA due to its anti-inflammatory effects. Despite growing interest, the evidence regarding colchicine efficacy and safety in OA management remains inconclusive. This study aims to assess the safety and efficacy of colchicine in treating OA.
Methods: We conducted a systematic search across multiple databases, such as PubMed, Web of Science, and Scopus from inception till April 5th, 2025. We included randomized clinical trials evaluating the efficacy and safety of colchicine in OA (Fig 1). The main outcome was pain measured by visual analogue scale (VAS). We stratified the outcome into three follow-up intervals: short-term (4 and 8 weeks), medium-term (10, 12 and 16 weeks), and long-term (20 and 24 weeks or longer). We used Rayyan for identifying duplicates, title, abstract and full-text screening and Review Manager (RevMan) software Version 5.4 for meta-analysis.
Results: This systematic review and meta-analysis incorporates data from a total of 21 clinical trials encompassing 6,965 participants, with 13 contributing to the meta-analysis including 879 participants. The main objective was to assess the efficacy of colchicine across multiple outcome measures. Pain relief, assessed by VAS, exhibited a significant short-term improvement at week 8 (standardized mean difference [SMD] = -1.03, 95% confidence interval [CI]: -2.01, -0.06, p=0.04), and a non-significant improvement at medium-term follow-up at week 12 (SMD = -0.34, 95% CI: -0.78, 0.10, p=0.75), and a significant long-term improvement at week 20 follow-up (SMD = -1.24, 95% CI: -1.73, -0.76, p< 0.00001), with an overall significant improvement (SMD = -0.73, 95% CI:-1.06, -0.41, p < 0.00001) (Fig 2). Similarly, quality of life indicated significant impact of colchicine treatment (SMD = -0.48, 95% CI: -0.83, -0.12, p =0.008). However, for physical dysfunction, the analysis reveals no statistically significant difference (SMD = -0.21, 95% CI: -0.45, 0.04, p=0.09), with significant difference in adverse events (AEs) (risk ratio [RR]: 1.27; 95% CI:1.07, 1.50, p=0.007) between colchicine and control groups (Fig 3).
Conclusion: This is the most recent and comprehensive systematic review and meta-analysis showing that colchicine is an effective therapeutic option for OA, with significant pain relief measured by VAS score. Additionally, it contributes to improved quality of life in patients with OA. However, physical dysfunction did not show significant differences. Future research should focus on optimal dosing, long-term safety, and larger randomized controlled trials to validate these findings.
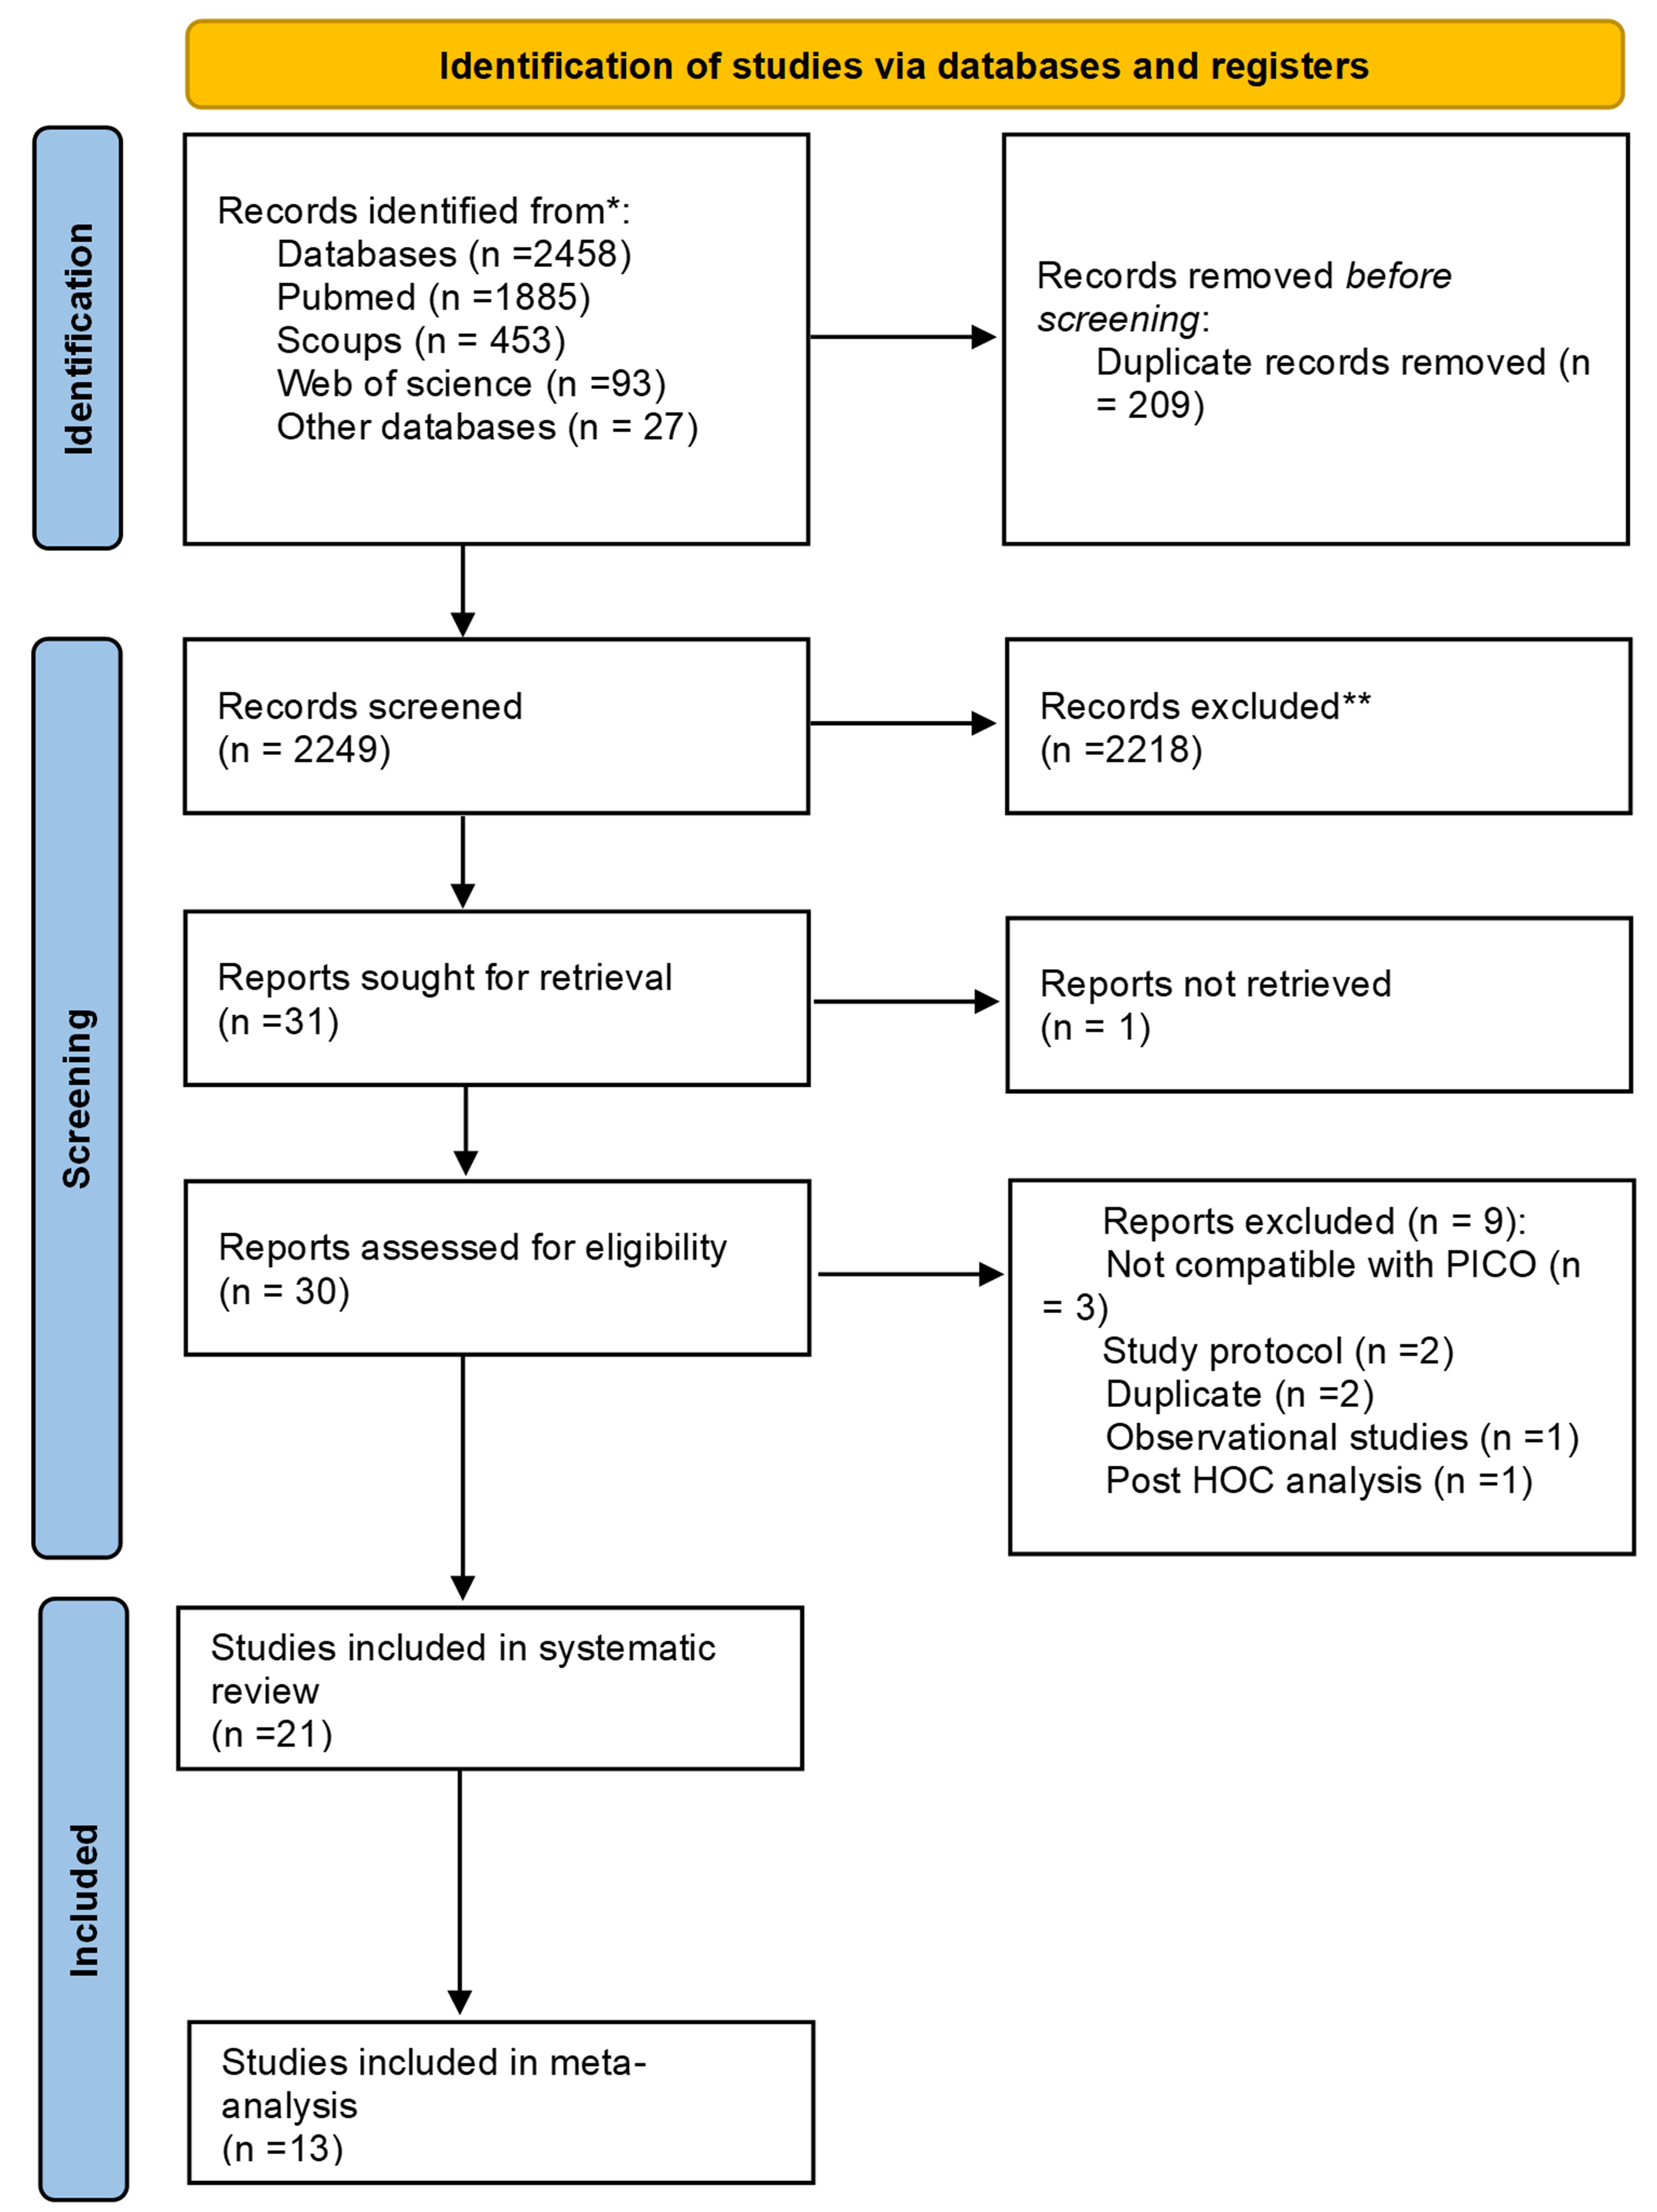 Figure (1) PRISMA Flow Chart Illustrating Search Strategy and Selection of Included Studies
.jpg?1) Figure (2) (A) Forest Plot of Pain Reduction (VAS) at Various Time Points (Random-Effects Model. Forest plot of pain reduction measured using VAS at various time points. The plot includes subgroups based on follow-up duration. Subgroup at 4 Weeks: Studies included: Das 2002 (OC). Subgroup at 8 Weeks: Studies included: Cioroianu 2022, Das 2002 (OC), Habeeb 2022. Subgroup at 10 Weeks: Studies included: Pandey 2016. Subgroup at 12 Weeks: Studies included: Amirpour 2016, Das 2002 (AC), Das 2002 (OC), Davis 2021, Dossing 2023, Erturk 2023, Samuel 2024. Subgroup at 16 Weeks: Studies included: Amirpour 2016, Cioroianu 2022, Das 2002 (OC), Habeeb 2022, Leung 2018. Subgroup at 20 Weeks: Studies included: Das 2002 (OC), Pandey 2016. Subgroup at 24 Weeks or More: Studies included: Erdin 2012, Pandey 2016. Overall: The plot shows a significant SMD in pain reduction of -0.73 (95% CI: -1.06 to -0.41), with considerable heterogeneity (I² = 97%). Test for overall effect: Z = 4.46 (P < 0.00001). Test for subgroup differences: Chi² = 25.71, df = 6 (P = 0.0003), I² = 76.7%. (B). Forest Plot of Pain Reduction (VAS) at Various Time Points (Fixed-Effects Model) Studies Included same as the Random effect model. Overall: The plot shows a significant SMD in pain reduction of -1.30 (95% CI: -1.35 to -1.26), with considerable heterogeneity (I² = 97%). Test for overall effect: Z = 64.97 (P < 0.00001). Test for subgroup differences: Chi² = 418.79, df = 6 (P < 0.00001), I² = 98.6%. (C) Forest Plot of KOA Pain Reduction (VAS) at Various Time Points (Random-Effects Model): The plot includes subgroups based on follow-up duration: Subgroup at 4 Weeks: Studies included: Das 2002 (OC). Subgroup at 8 Weeks: Studies included: Cioroianu 2022, Das 2002 (OC), Habeeb 2022. Subgroup at 10 Weeks: Studies included: Pandey 2016. Subgroup at 12 Weeks: Studies included: Amirpour 2016, Das 2002 (AC), Das 2002 (OC), Samuel 2024. Subgroup at 16 Weeks: Studies included: Amirpour 2016, Cioroianu 2022, Das 2002 (OC), Habeeb 2022, Leung 2018. Subgroup at 20 Weeks: Studies included: Das 2002 (AC), Das 2002 (OC), Pandey 2016. Subgroup at 24 Weeks or More: Studies included: Erdin 2012, Pandey 2016. Overall: The plot shows a significant mean difference in pain reduction of -0.76 (95% CI: -1.10 to -0.42), with high heterogeneity (I² = 98%). Test for overall effect: Z = 4.44 (P < 0.00001). Test for subgroup differences: Chi² = 23.36, df = 6 (P < 0.0007), I² = 74.3%. (D): Forest Plot of HOA Pain Reduction (VAS) (Random-Effects Model) Studies included: Davis 2021, Dossing 2023, Erturk 2023. Overall: The plot shows a non-significant SMD in pain reduction of -0.48 (95% CI: -1.29 to 0.33), with high heterogeneity (I2=90%). Test for overall effect: Z=1.17(P=0.24). Heterogeneity Tau2=0.33, Chi2=19.22, df=2 (P < 0.0001)
Figure (2) (A) Forest Plot of Pain Reduction (VAS) at Various Time Points (Random-Effects Model. Forest plot of pain reduction measured using VAS at various time points. The plot includes subgroups based on follow-up duration. Subgroup at 4 Weeks: Studies included: Das 2002 (OC). Subgroup at 8 Weeks: Studies included: Cioroianu 2022, Das 2002 (OC), Habeeb 2022. Subgroup at 10 Weeks: Studies included: Pandey 2016. Subgroup at 12 Weeks: Studies included: Amirpour 2016, Das 2002 (AC), Das 2002 (OC), Davis 2021, Dossing 2023, Erturk 2023, Samuel 2024. Subgroup at 16 Weeks: Studies included: Amirpour 2016, Cioroianu 2022, Das 2002 (OC), Habeeb 2022, Leung 2018. Subgroup at 20 Weeks: Studies included: Das 2002 (OC), Pandey 2016. Subgroup at 24 Weeks or More: Studies included: Erdin 2012, Pandey 2016. Overall: The plot shows a significant SMD in pain reduction of -0.73 (95% CI: -1.06 to -0.41), with considerable heterogeneity (I² = 97%). Test for overall effect: Z = 4.46 (P < 0.00001). Test for subgroup differences: Chi² = 25.71, df = 6 (P = 0.0003), I² = 76.7%. (B). Forest Plot of Pain Reduction (VAS) at Various Time Points (Fixed-Effects Model) Studies Included same as the Random effect model. Overall: The plot shows a significant SMD in pain reduction of -1.30 (95% CI: -1.35 to -1.26), with considerable heterogeneity (I² = 97%). Test for overall effect: Z = 64.97 (P < 0.00001). Test for subgroup differences: Chi² = 418.79, df = 6 (P < 0.00001), I² = 98.6%. (C) Forest Plot of KOA Pain Reduction (VAS) at Various Time Points (Random-Effects Model): The plot includes subgroups based on follow-up duration: Subgroup at 4 Weeks: Studies included: Das 2002 (OC). Subgroup at 8 Weeks: Studies included: Cioroianu 2022, Das 2002 (OC), Habeeb 2022. Subgroup at 10 Weeks: Studies included: Pandey 2016. Subgroup at 12 Weeks: Studies included: Amirpour 2016, Das 2002 (AC), Das 2002 (OC), Samuel 2024. Subgroup at 16 Weeks: Studies included: Amirpour 2016, Cioroianu 2022, Das 2002 (OC), Habeeb 2022, Leung 2018. Subgroup at 20 Weeks: Studies included: Das 2002 (AC), Das 2002 (OC), Pandey 2016. Subgroup at 24 Weeks or More: Studies included: Erdin 2012, Pandey 2016. Overall: The plot shows a significant mean difference in pain reduction of -0.76 (95% CI: -1.10 to -0.42), with high heterogeneity (I² = 98%). Test for overall effect: Z = 4.44 (P < 0.00001). Test for subgroup differences: Chi² = 23.36, df = 6 (P < 0.0007), I² = 74.3%. (D): Forest Plot of HOA Pain Reduction (VAS) (Random-Effects Model) Studies included: Davis 2021, Dossing 2023, Erturk 2023. Overall: The plot shows a non-significant SMD in pain reduction of -0.48 (95% CI: -1.29 to 0.33), with high heterogeneity (I2=90%). Test for overall effect: Z=1.17(P=0.24). Heterogeneity Tau2=0.33, Chi2=19.22, df=2 (P < 0.0001)
CI, confidence interval; df, degrees of freedom; IV, inverse variance; SMD, standardized mean difference; VAS, Visual Analog Scale.
.jpg?1) Figure (3) (A): Forest Plot of Physical Dysfunction Improvement (WOMAC) (Random-Effects Model) The plot includes subgroups based on follow-up duration: Subgroup at 4 Weeks: Studies included: Das 2002 (OC). Subgroup at 8 Weeks: Studies included: Cioroianu 2022, Das 2002 (OC), Habeeb 2022. Subgroup at 10 Weeks: Studies included: Pandey 2016. Subgroup at 12 Weeks: Studies included: Das 2002 (AC), Das 2002 (OC). Subgroup at 16 Weeks: Studies included: Cioroianu 2022, Das 2002 (OC), Habeeb 2022, Leung 2018. Subgroup at 20 Weeks: Studies included: Das 2002 (AC), Das 2002 (OC), Pandey 2016. Subgroup at 24 Weeks or More: Studies included: Erdin 2012, Pandey 2016. Overall: The plot shows a non-significant standardized mean difference (SMD) in physical dysfunction improvement of -0.21 (95% CI: -0.45 to 0.04), with moderate heterogeneity (I2=62%). Test for overall effect: Z=1.67(P=0.09). Heterogeneity: Tau2=0.10,Chi2=39.56,df=15(P=0.0005). Test for subgroup differences: Chi2=23.79,df=6(P=0.0006),I2=74.8%.
Figure (3) (A): Forest Plot of Physical Dysfunction Improvement (WOMAC) (Random-Effects Model) The plot includes subgroups based on follow-up duration: Subgroup at 4 Weeks: Studies included: Das 2002 (OC). Subgroup at 8 Weeks: Studies included: Cioroianu 2022, Das 2002 (OC), Habeeb 2022. Subgroup at 10 Weeks: Studies included: Pandey 2016. Subgroup at 12 Weeks: Studies included: Das 2002 (AC), Das 2002 (OC). Subgroup at 16 Weeks: Studies included: Cioroianu 2022, Das 2002 (OC), Habeeb 2022, Leung 2018. Subgroup at 20 Weeks: Studies included: Das 2002 (AC), Das 2002 (OC), Pandey 2016. Subgroup at 24 Weeks or More: Studies included: Erdin 2012, Pandey 2016. Overall: The plot shows a non-significant standardized mean difference (SMD) in physical dysfunction improvement of -0.21 (95% CI: -0.45 to 0.04), with moderate heterogeneity (I2=62%). Test for overall effect: Z=1.67(P=0.09). Heterogeneity: Tau2=0.10,Chi2=39.56,df=15(P=0.0005). Test for subgroup differences: Chi2=23.79,df=6(P=0.0006),I2=74.8%.
(B): Forest Plot of Quality of Life (QoL) Improvement (Random-Effects Model) The plot includes subgroups based on follow-up duration: Subgroup at 4 Weeks: Studies included: Das 2002 (OC). Subgroup at 8 Weeks: Studies included: Das 2002 (OC). Subgroup at 10 Weeks: Studies included: Pandey 2016. Subgroup at 12 Weeks: Studies included: Aminpour 2016, Aran 2011, Das 2002 (AC), Das 2002 (OC). Subgroup at 16 Weeks: Studies included: Aminpour 2016, Das 2002 (OC), Leung 2018. Subgroup 20 Weeks: Studies included: Das 2002 (AC), Das 2002 (OC), Pandey 2016. Subgroup at 26 Weeks: Studies included: Pandey 2016. Overall: The plot shows a significant SMD in QoL improvement of -0.48 (95% CI: -0.83 to -0.12), with considerable heterogeneity (I2=83%). Test for overall effect: Z=2.66(P=0.008). Heterogeneity: Tau2=0.31,Chi2=76.54,df=13(P < 0.00001). Test for subgroup differences: Chi2=20.73, df=6 (P=0.002), I2=71.0%. (C): Forest Plot of Adverse Events in Colchicine vs Control groups (Fixed-Effects Model) Studies included: Amirpour 2016, Aran 2011, Das 2002 (AC), Davis 2021, Dossing 2023, Habeeb 2022, Leung 2018. Overall: The plot shows a significant RR in pain reduction of -1.27 (95% CI: 1.07 to 1.50), with Considerable heterogeneity (I2=81%).
CI, confidence interval; df, degrees of freedom; IV, inverse variance; SMD, standardized mean difference; WOMAC, Western Ontario and McMaster Universities Osteoarthritis Index; RR, Risk Ratio; QoL, Quality of Life.
Disclosures: M. Abdelsalam: None; B. Badwy: None; M. Mahdy: None; M. Lasheen: None; H. Hafez: None; O. El Sedafy: None; M. Awad: None.
To cite this abstract in AMA style:
Abdelsalam M, Badwy B, Mahdy M, Lasheen M, Hafez H, El Sedafy O, Awad M. Safety and Efficacy of Colchicine in Osteoarthritis: A Systematic Review and Meta-Analysis of 6,965 Patients [abstract]. Arthritis Rheumatol. 2025; 77 (suppl 9). https://acrabstracts.org/abstract/safety-and-efficacy-of-colchicine-in-osteoarthritis-a-systematic-review-and-meta-analysis-of-6965-patients/. Accessed .« Back to ACR Convergence 2025
ACR Meeting Abstracts - https://acrabstracts.org/abstract/safety-and-efficacy-of-colchicine-in-osteoarthritis-a-systematic-review-and-meta-analysis-of-6965-patients/