Session Information
Session Type: Poster Session B
Session Time: 10:30AM-12:30PM
Background/Purpose: Myopathy in SSc significantly increases disability, reduces quality of life, and elevates mortality risk, yet remains understudied. Most identified risk factors derive from cross-sectional studies, limiting insights into longitudinal patterns and hindering time-varying risk prediction of myopathy at the individual patient level.
Methods: We analyzed longitudinal data from a cohort of over 2,800 SSc patients in a SSc research registry, totaling approximately 24,000 visits. Among included patients, 97.6% met 1980 or 2013 ACR/EULAR classification criteria. To examine clinical risk factors for incident muscle involvement (new onset between consecutive visits), we used multivariable logistic regression models separately across three dichotomized outcomes: proximal muscle weakness (Medsger Muscle Severity Score [MSS] ≥ 1), elevated creatine phosphokinase (CPK ≥ 200 U/L), and their co-occurrence as a myopathy surrogate (MSS/CPK-defined myopathy). To support individualized risk prediction, we developed a Bayesian generalized linear mixed model for cross-validated sequential prediction, using MSS as an example outcome to showcase and validate our approach. The model incorporated baseline and time-varying characteristics, along with patient-specific medical history, to produce individualized risk trajectories. Cross-validation was used for efficiency and proper performance evaluation, and LASSO logistic regression model was used for variable selection.
Results: Several demographic, autoantibody, and comorbidity-related factors were associated with increased odds of incident MSS/CPK-defined myopathy. Notable predictors included diffuse subtype (OR=2.36 [1.68, 3.32]), Black race (OR=2.08 [1.49, 2.92]), anti-PM/Scl (positivity for both subunits, OR=3.42 [1.80, 6.51]), anti-Ku (OR=2.99 [1.95, 4.60]), anti-Fibrillarin (OR=1.95 [1.31, 2.91]), restrictive lung disease (ppFVC ≤ 70%) (OR=2.03 [1.46, 2.82]), tendon friction rubs (OR=1.97 [1.22, 3.17]), and moderate-severe GI involvement (OR=1.37 [1.04, 1.80]). Anti-Scl70 (OR=0.46 [0.31, 0.67]), anti-RNA polymerase III (OR=0.62 [0.41, 0.94]), and anti-U1RNP (OR=0.67 [0.46, 0.99]) were linked to lower odds of incident myopathy. Our prediction model for MSS (AUC: 0.867 [0.864, 0.869]) outperformed standard regression and random forest models, which did not capture the complete patient-specific history. With new data emerging at each visit, our method generates updated, real-time individualized predicted risk of abnormal MSS for the next visit (Figure 1).
Conclusion: This study identified key baseline and time-varying risk factors linked to SSc-associated myopathy and, to our knowledge, introduced the first longitudinal, real-time, individualized prediction model for a myopathy-related outcome (MSS). Our approach addresses unmet needs in monitoring SSc-associated myopathy by combining population-level risk factors with dynamic personalized risk assessment, potentially enabling more timely interventions. This method can be easily translated to modeling other longitudinal outcomes in electronic health record data for improved risk estimation in chronic diseases.
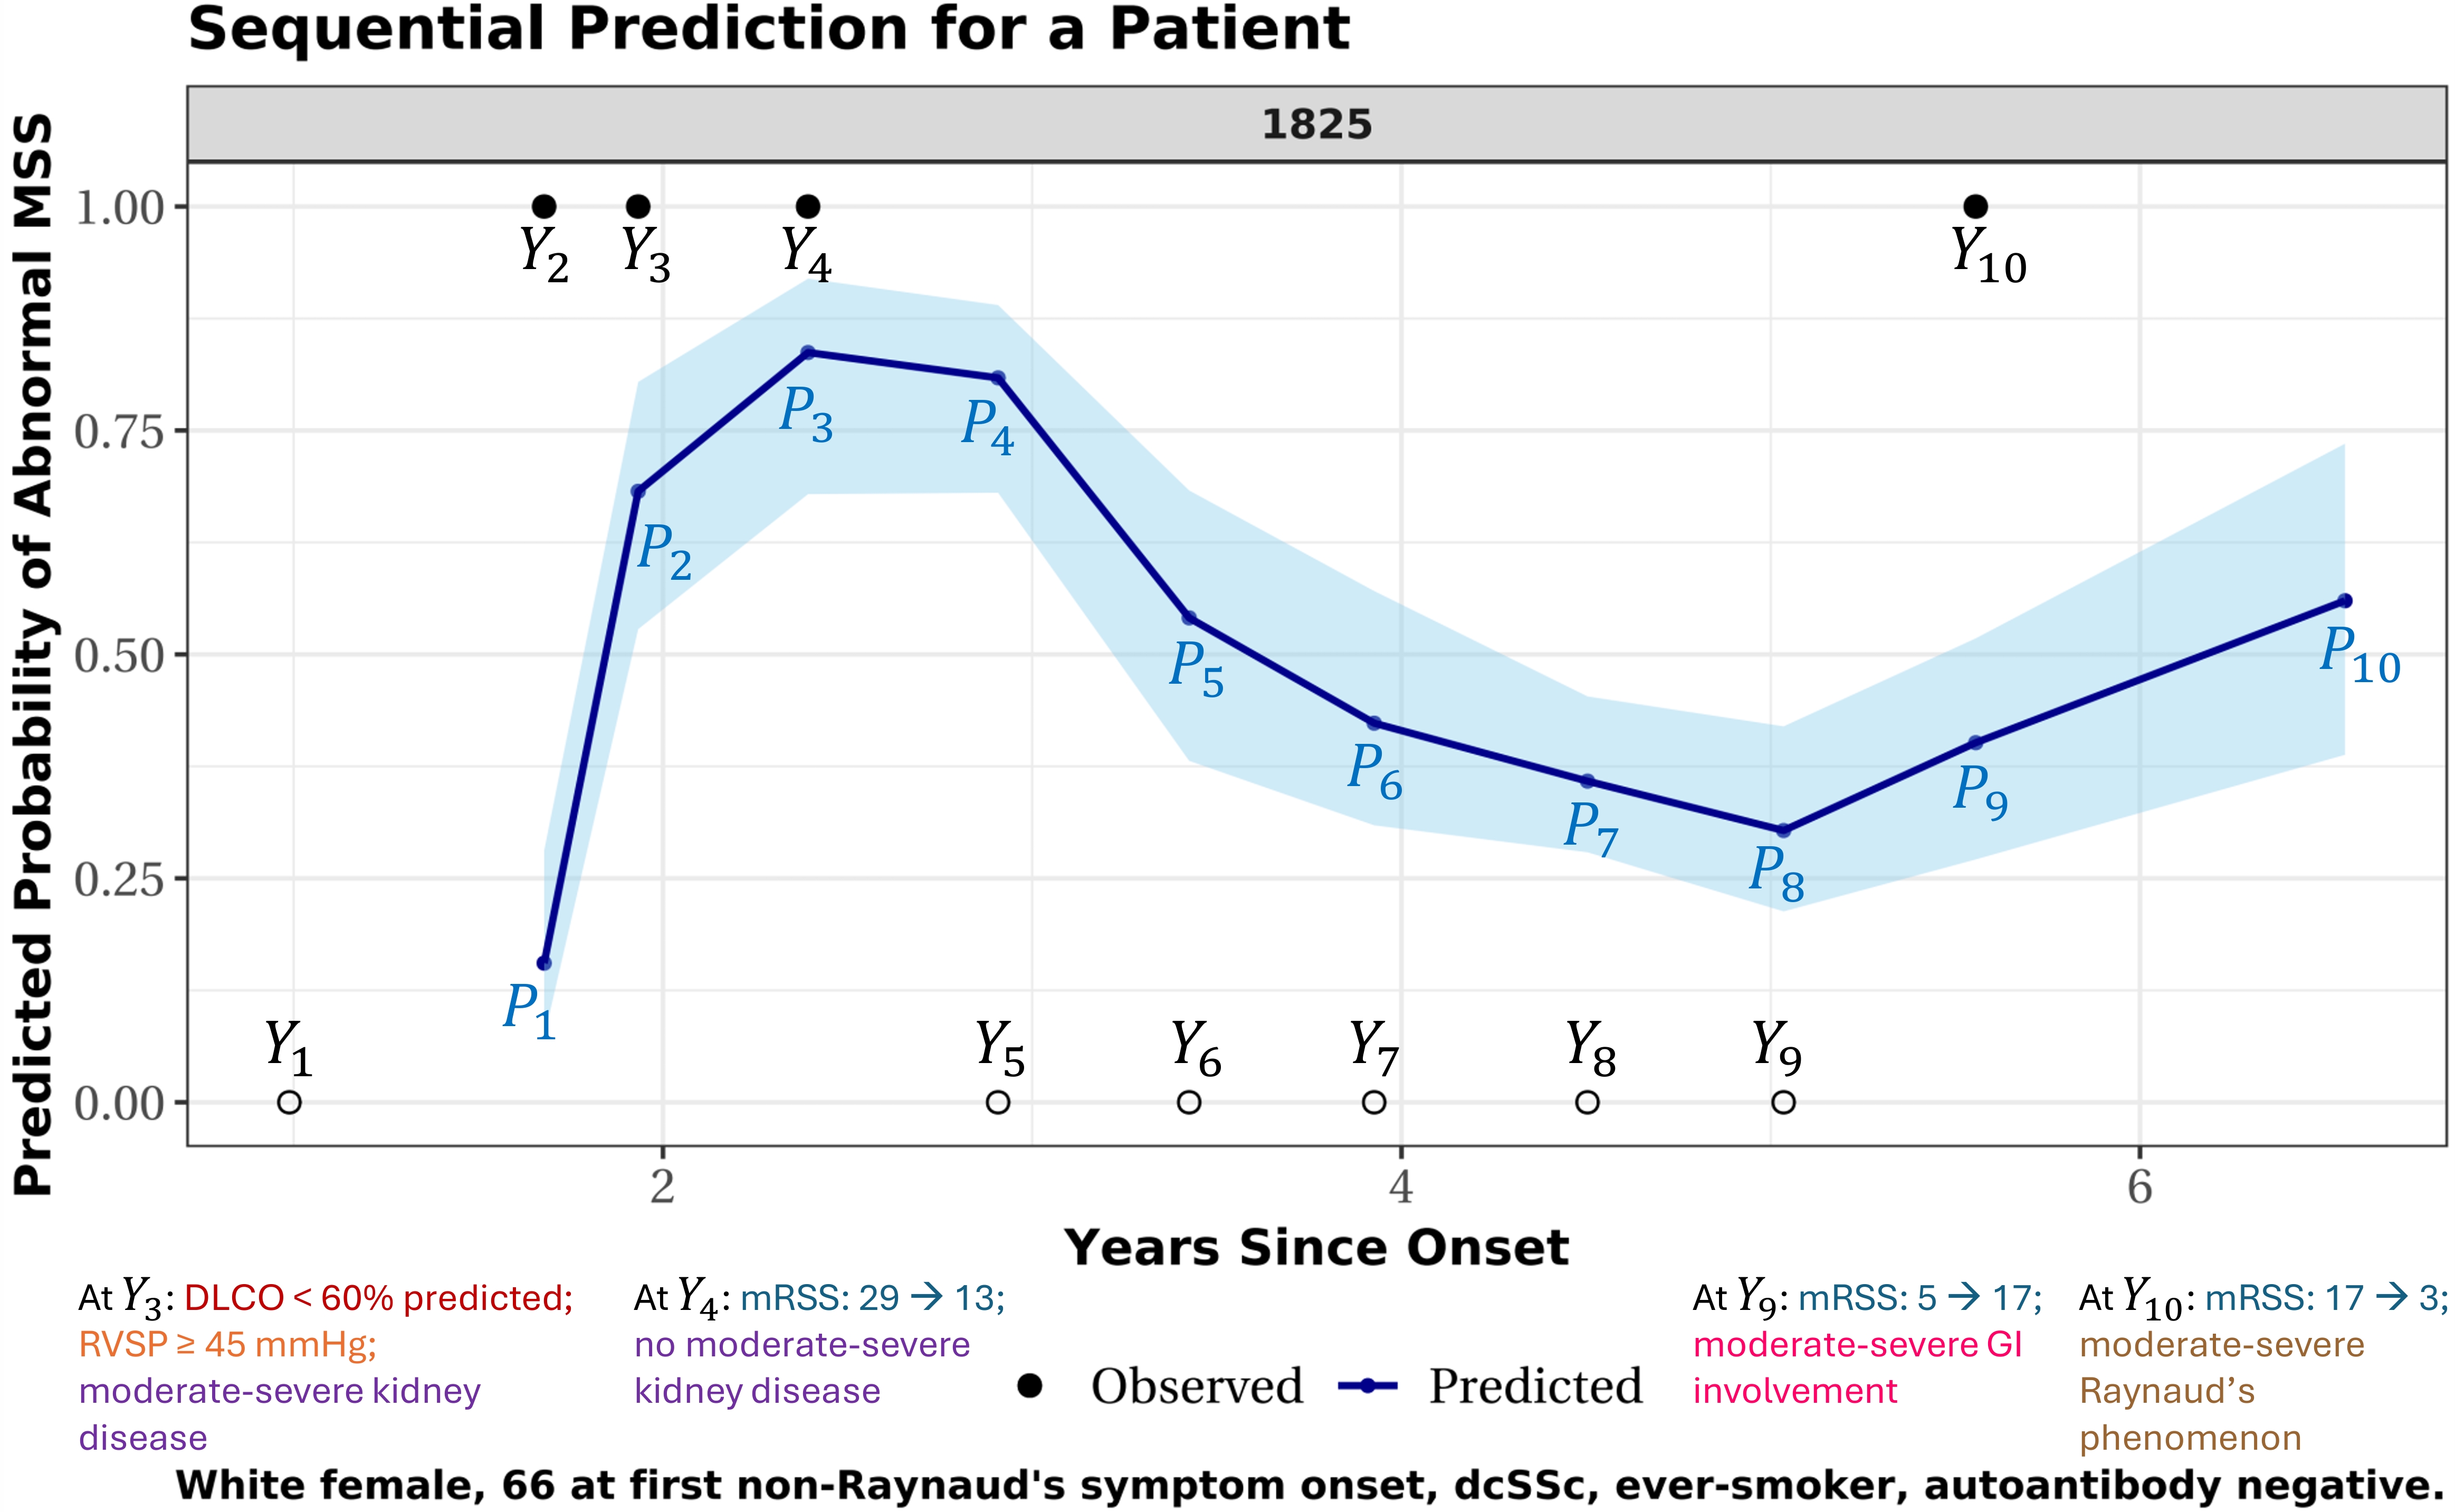 Figure 1. Predicted probability trajectory of abnormal MSS (proximal muscle weakness) for one patient. X-axis: years since the onset of first non-Raynaud’s SSc symptom. Observed MSS outcomes labeled Y1-Y10: solid dots = abnormal MSS, empty circles = normal MSS. This patient initially presented with normal MSS, followed by three visits with abnormal MSS, then five consecutive visits with normal MSS, and a final visit with abnormal MSS. Predicted probabilities of abnormal MSS (P1-P10) are shown in dark blue, with 95% confidence intervals in light blue. Each prediction estimates the risk of abnormal MSS for the next visit using all available clinical information up to the current point. For example, prediction P1 estimates the risk for visit 2 (where outcome Y2 is to be observed), using only data from visit 1 (i.e., the measured outcome Y1 and associated clinical measurements). Similarly, P2 predicts the risk for visit 3 (where outcome Y3 is to be observed), using data from visits 1 and 2 (i.e., outcomes Y1-Y2 and associated clinical measurements). And P3 predicts the risk for visit 4 using earlier data from visits 1-3. This one-step-forward prediction process continues sequentially through all visits, with the final prediction, P10, estimating risk one year after the last observed visit using data from all 10 visits. Colored text annotations appear at selected visits and summarize clinical changes observed at that visit, relative to the previous one. These changes inform the next prediction (e.g., changes at visit 3, when outcome Y3 is measured, inform P3, the predicted risk for the following outcome Y4 to be observed at visit 4).
DLCO: diffusing capacity for carbon monoxide (percent predicted); RVSP: right ventricular systolic pressure (≥ 45 mmHg indicates echocardiographic evidence of pulmonary hypertension); moderate-severe kidney disease: serum creatinine ≥ 1.7 mg/dL, 3-4+ proteinuria, or history of SSc renal crisis; moderate-severe GI involvement: high-dose GERD treatment, antibiotics for bacterial overgrowth, malabsorption syndrome, pseudo-obstruction, or total parenteral nutrition; moderate-severe Raynaud’s phenomenon: Raynaud’s with digital pitting scars, digital ulcers, or digital gangrene.
To cite this abstract in AMA style:
Liu Z, Woods A, Paik J, Hummers L, Zeger S, Shah A, Kim J. Risk Factor Identification and Dynamic Individualized Prediction of Muscle Involvement in Systemic Sclerosis [abstract]. Arthritis Rheumatol. 2025; 77 (suppl 9). https://acrabstracts.org/abstract/risk-factor-identification-and-dynamic-individualized-prediction-of-muscle-involvement-in-systemic-sclerosis/. Accessed .« Back to ACR Convergence 2025
ACR Meeting Abstracts - https://acrabstracts.org/abstract/risk-factor-identification-and-dynamic-individualized-prediction-of-muscle-involvement-in-systemic-sclerosis/