Session Information
Session Type: Abstract Submissions (ACR)
Background/Purpose: ACPA+ individuals with non-specific musculoskeletal symptoms are at high risk of developing rheumatoid arthritis (RA). We previously demonstrated dys-regulation of T-cell subsets with loss of naïve and regulatory T-cells (Treg) in early RA. The aim of the current study is to demonstrate the predictive value of T-cell subset analysis for progression towards inflammatory arthritis (IA) onset in ACPA+ individuals.
Methods: 82 ACPA+ individuals without clinical synovitis at recruitment were followed. 120 healthy controls provided a reference group. T-cell subset analyses were performed using 6-colour flowcytometry for naïve T-cells (CD4+CD45RB+CD45RA+CD62L+), Treg (CD4+CD25highFoxp3+CD127low) and inflammation related cells (IRC: CD4+CD45RB+CD45RA+CD62L-). We calculated one-sided 95% reference ranges for each subset (age-related for naïve and Treg) and classified values as normal or abnormal accordingly. Using Cox proportional hazards regression we created a risk score; each subset’s coefficient rounded to nearest 0.5, multiplied by 2, then a total score for each person was calculated. Risk categories were then derived based on the proportions of patients progressing at each score level.
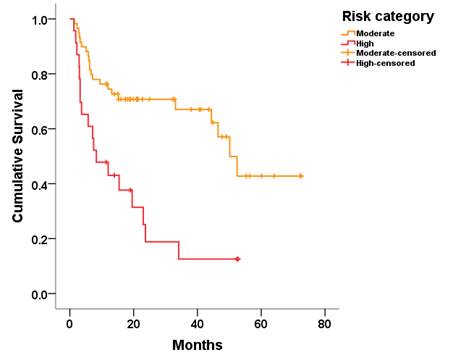
Results: In this cohort 40/82 (49%) developed IA within a median follow-up of 6.4 months (range 1-52 months). Cox regression analysis (Table 1) allowed categorisation into moderate and high risk. Within the high risk group 78% (18/23) progressed to IA in a median of 8 months compared to 37% (22/59) within the moderate group (Table 2; Figure 1).
Conclusion: T-cell dys-regulation in ACPA+ individuals with non-specific musculoskeletal pain may be useful in predicting progression to IA. Further modelling will be needed to quantify the added clinical utility of T-cell subsets in predicting progression to IA.
Table 1: Sensitivity and specificity of T-cell subset frequencies for progression to IA; results of multivariable Cox regression and risk scores for each subset
|
|
Cut-off |
Sensitivity |
Specificity |
HR (95% CI) |
Coefficient: score |
|
Naïve |
30.0 (18.1, 45.4) 83.3 (69.4, 91.7) 1.6 (0.8, 3.3) 0.5: 1 | ||||
|
IRC |
>4.56 |
32.5 (20.1, 48.0) |
90.5 (77.9, 96.2) |
2.4 (1.2, 4.6) |
0.9: 2 |
|
Treg |
< LLN for age |
45.0 (30.7, 60.2) |
73.8 (58.9, 84.7) |
1.6 (0.8, 2.9) |
0.4: 1 |
LLN=lower limit of normal (one-sided age-related 95% reference range)
Table 2: Proportions of people progressing to IA according to T-cell risk score; risk categories derived
|
T-cell risk score |
% progressed to IA (n/N) |
Risk category |
Median (95% CI) months to IA |
|
0 |
31% (10/32) |
Moderate |
50 (41, 58) |
|
1 |
44% (12/27) |
||
|
2 |
73% (11/15) |
High |
8 (1, 16) |
|
3 |
86% (6/7) |
||
|
4 |
100% (1/1) |
Figure 1: Kaplan-Meier survival plot showing cumulative survival for people at moderate or high risk of progression to IA
Disclosure:
L. Hunt,
None;
A. Burska,
None;
E. M. A. Hensor,
None;
J. L. Nam,
None;
F. Ponchel,
None;
P. Emery,
None.
« Back to 2014 ACR/ARHP Annual Meeting
ACR Meeting Abstracts - https://acrabstracts.org/abstract/predicting-the-evolution-of-inflammatory-arthritis-in-acpa-positive-individuals-can-t-cell-subsets-model-help/

