Session Information
Session Type: Poster Session B
Session Time: 10:30AM-12:30PM
Background/Purpose: The MRI OsteoArthritis Knee Score (MOAKS) is increasingly used in studies of knee osteoarthritis. Our aim was to evaluate methods using MOAKS scores to define cartilage worsening outcomes, along with established OA risk factors, to determine optimal approaches for future analyses of cartilage worsening in MOST.
Methods: Participants were from the Multicenter Osteoarthritis Study (MOST) with MOAKS readings from a baseline and follow-up exam 2 years later. MOAKS scores articular cartilage in 14 subregions across the knee in 2 dimensions: area of loss as % of subregion surface (AREA); and % of subregion that has full-thickness loss (FTL). AREA and FTL are scored as 0: None; 1: < 10%; 2: 10-75%; 3: >75%. MRIs were scored in chronological order, including within-grade changes for definite visual change that do not fulfill criteria of a full grade change. Our primary methods for creating MOAKS outcomes include: summing the AREA and FTL across subregions for a whole-knee 0-84 score; summing AREA and 2*FTL across subregions to emphasize FTL in the score; and using an increase in AREA or FTL within a subregion for 14 subregion-specific binary scores within the knee. Within-grade values were included.
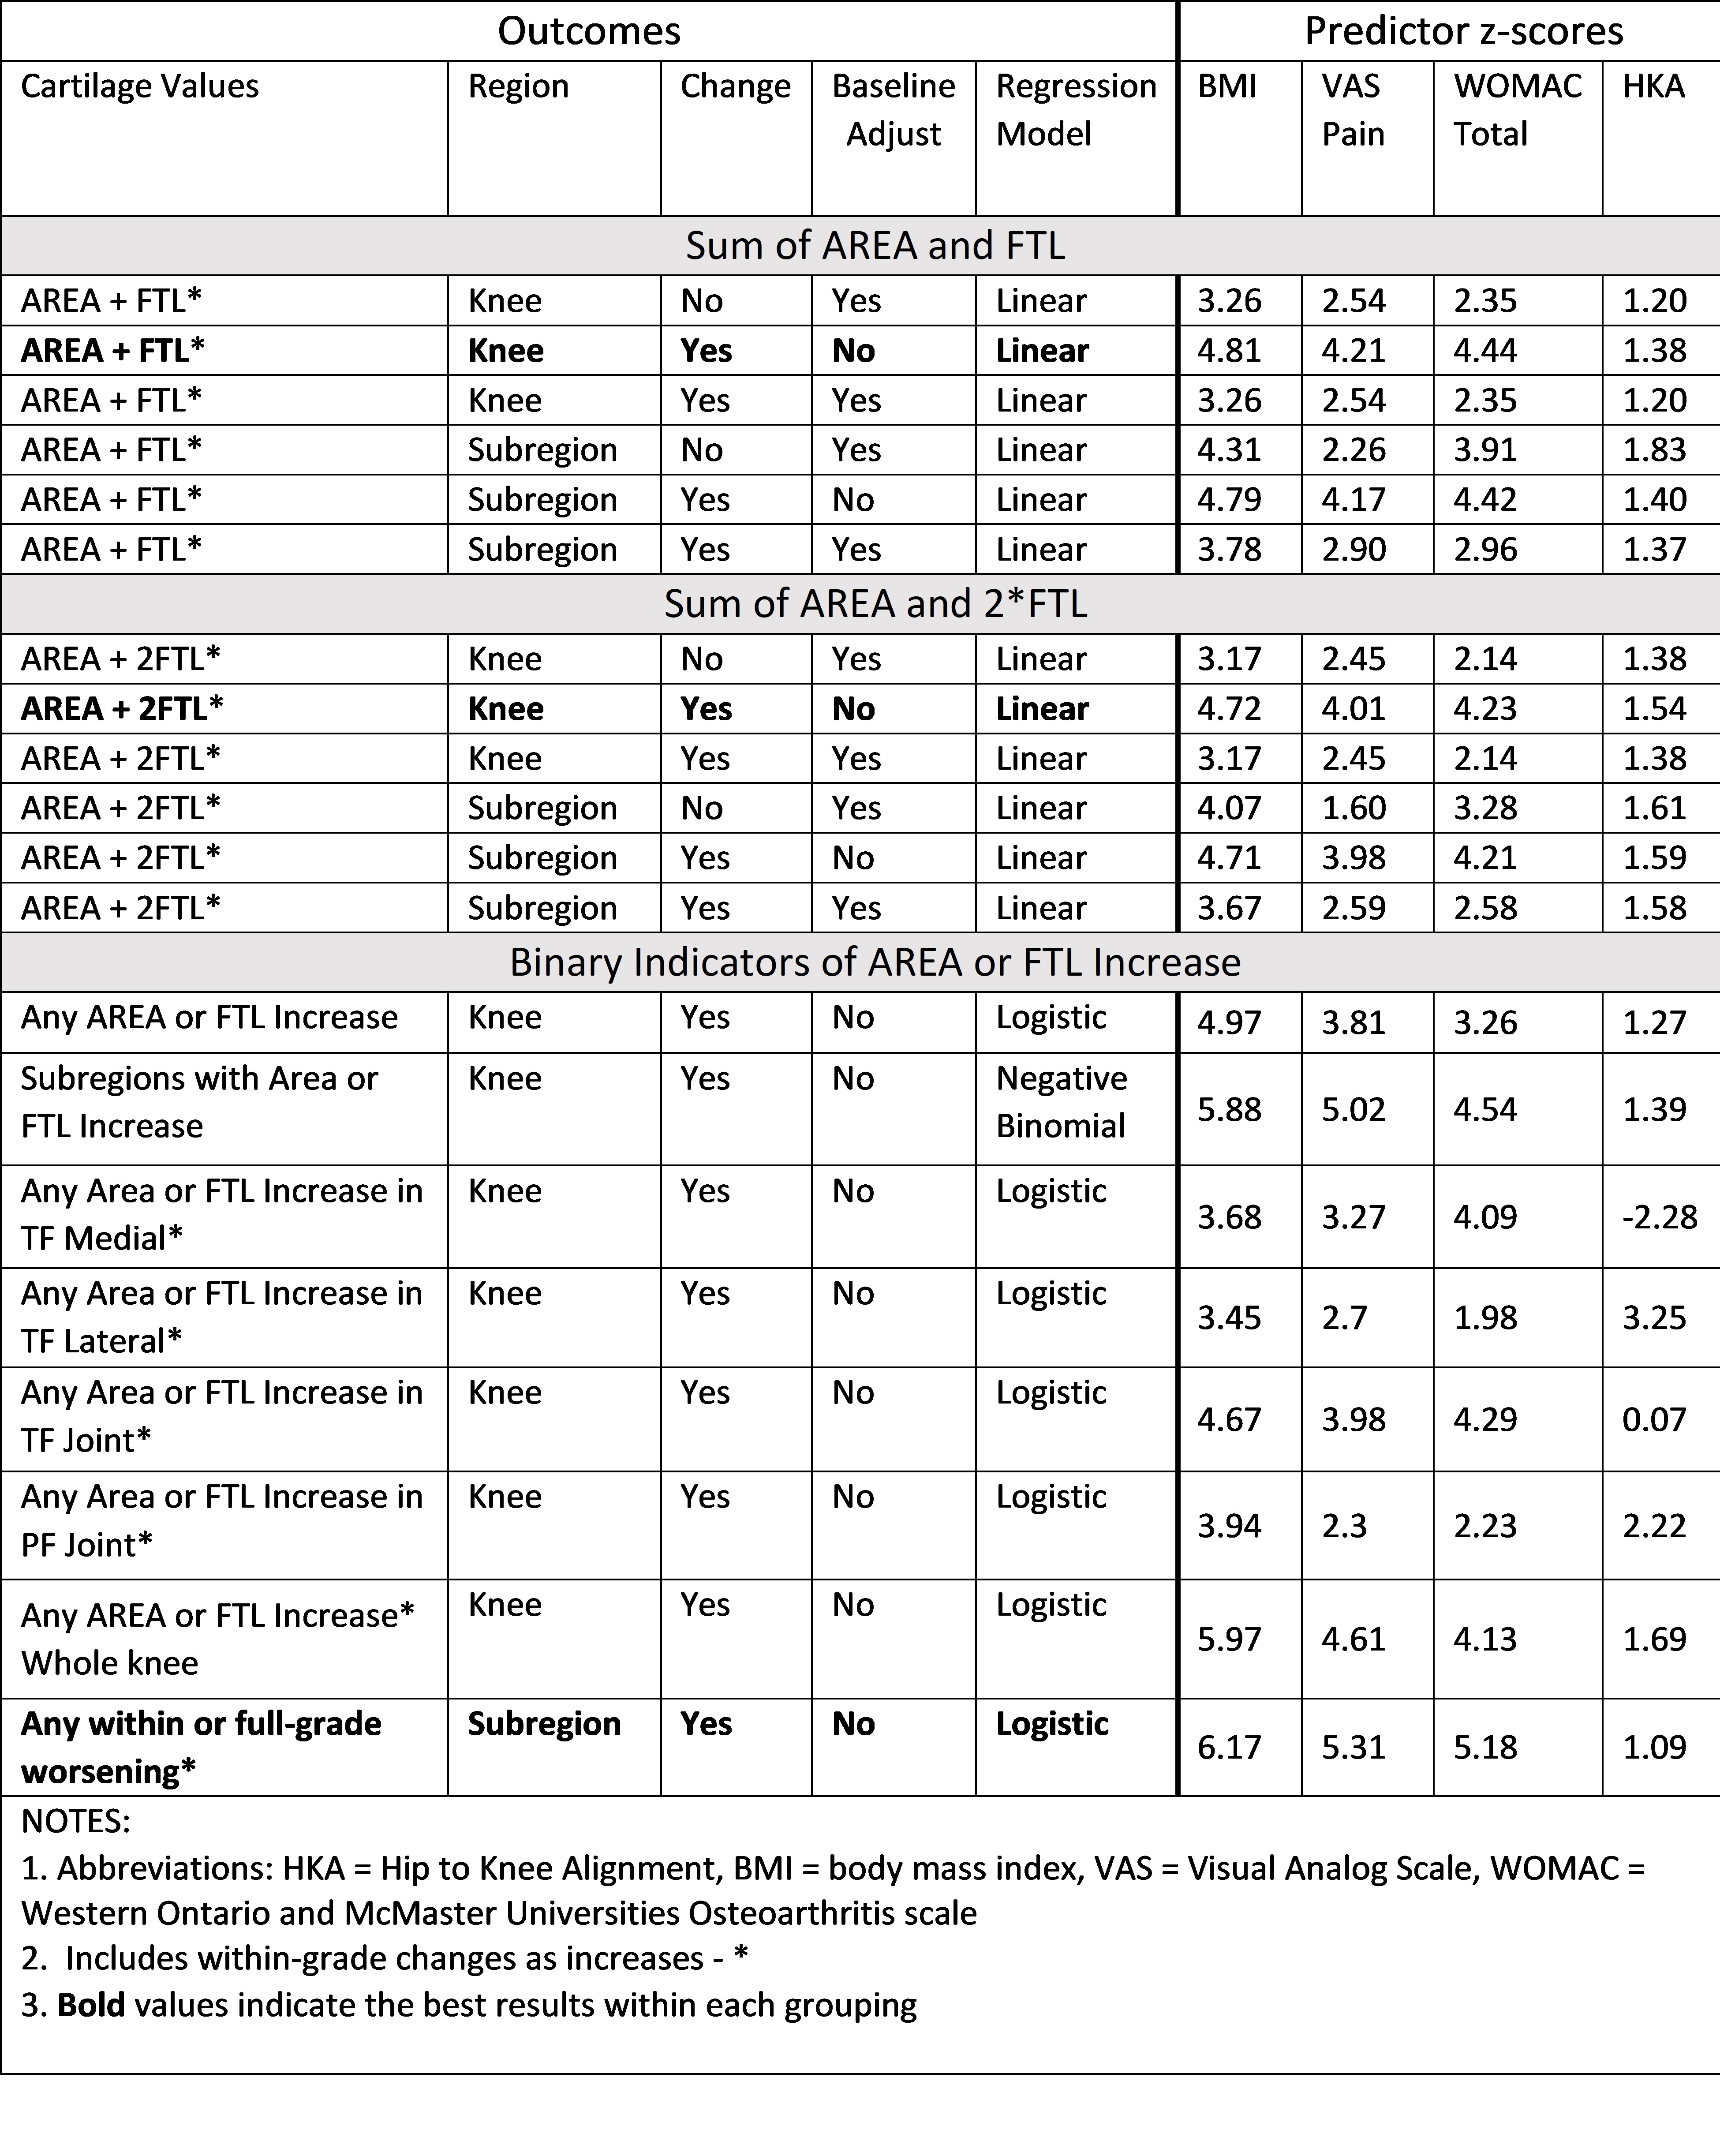
Linear regression outcomes were evaluated in 3 ways: follow-up value as outcome adjusted for the baseline value; change in value as the outcome (follow-up – baseline) unadjusted for the baseline value; and change in value as outcome adjusted for the baseline value. Table 2 lists the outcome measures, including the region represented, whether change and baseline adjustment are included, and the regression model combinations to be considered (linear; binary logistic; negative binomial).To determine the optimal outcome, strengths of association with several predictors are calculated: body mass index (BMI); knee pain on a visual analog scale (VAS); total WOMAC; and hip-to knee alignment (HKA). Predictors were measured at baseline; age and sex are included as covariates in all models. For all analyses, the strength of association is measured by the regression estimate divided by its standard error (z score).
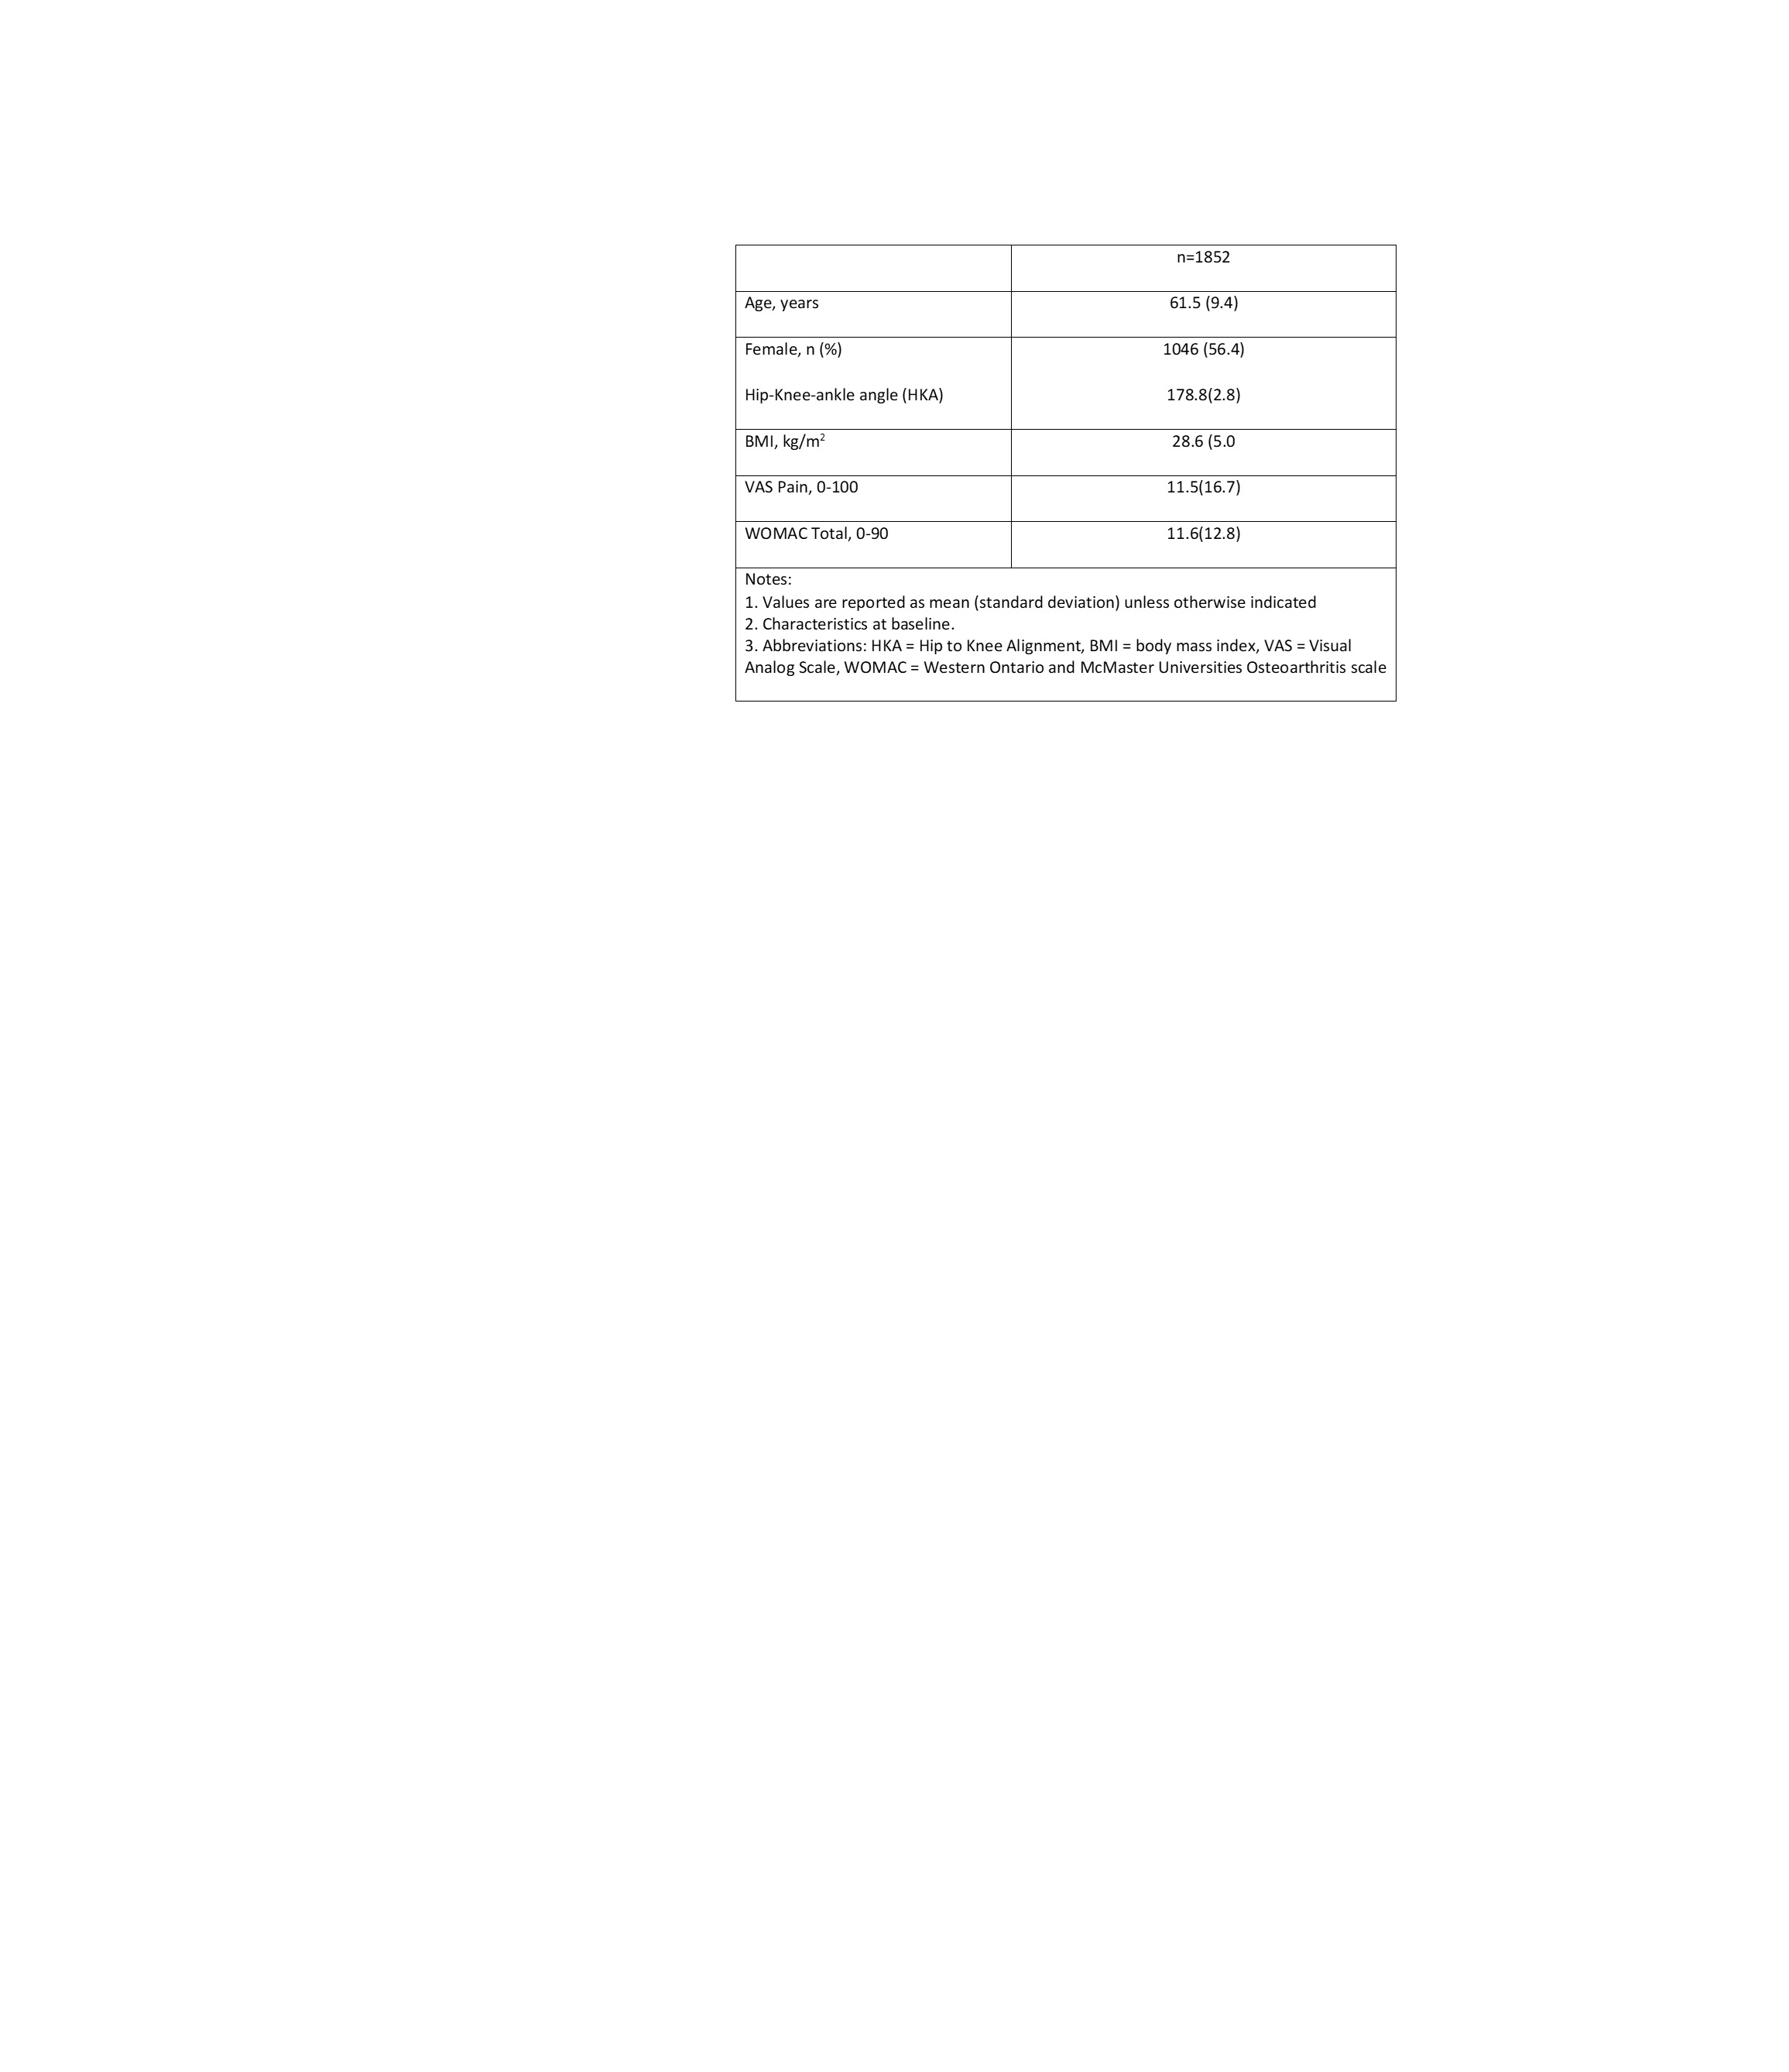
Results: We included 1852 MOST study participants with sequential MOAKS readings predictor and covariate values for 1 knee per participant; 25956 subregions across all knees. Z scores for association ranged from -2.28 to 6.17. The only outcome strongly associating with HKA used binary outcomes restricted to tibiofemoral lateral compartment. The overall strongest associations with predictors were in models using changes in MOAKS values without adjustment for the baseline value. The strongest associations were found for the outcome with binary subregional values including within-grade changes with GEE binary logistic regression and then the count of number of subregions worsened with negative binomial regression.
Conclusion: Outcomes for worsening cartilage based on MOAKS scores that performed the best used the changes in scores from baseline to 2-year follow-up without adjustment for baseline scores. The best outcome measure used binary worsening scores for an increase in either AREA or FTL in a subregion for 14-subregion-specific binary scores within the knee, accounting for within-grade increases.
To cite this abstract in AMA style:
Bacon K, LaValley m, Neogi T, Guermazi A, Roemer F, Segal N, Lewis C, Nevitt M, Felson D, Lynch J. Optimal Definitions of Worsening Cartilage Using Sequential MRI OsteoArthritis Knee Scores (MOAKS) [abstract]. Arthritis Rheumatol. 2024; 76 (suppl 9). https://acrabstracts.org/abstract/optimal-definitions-of-worsening-cartilage-using-sequential-mri-osteoarthritis-knee-scores-moaks/. Accessed .« Back to ACR Convergence 2024
ACR Meeting Abstracts - https://acrabstracts.org/abstract/optimal-definitions-of-worsening-cartilage-using-sequential-mri-osteoarthritis-knee-scores-moaks/


