Session Information
Date: Monday, October 27, 2025
Title: (1306–1346) Rheumatoid Arthritis – Diagnosis, Manifestations, and Outcomes Poster II
Session Type: Poster Session B
Session Time: 10:30AM-12:30PM
Background/Purpose: Spectral analysis of liquid biopsies has recently emerged as a promising, non-invasive approach to improve the diagnosis of various pathologies. Our objective was to develop a rapid and precise strategy to differentiate among clinically challenging rheumatic inflammatory and autoimmune diseases, as well as to assess their severity, by analyzing the spectral properties of peripheral blood.
Methods: We recruited patients with rheumatoid arthritis (RA, n=47), ankylosing spondylitis (AS, n=27), fibromyalgia syndrome (FMs, n=43), along with healthy controls (n=45). Disease activity was assessed using the Disease Activity Score-28 (DAS-28) for RA, the Bath Ankylosing Spondylitis Disease Activity Index (BASDAI) for AS, and the Fibromyalgia Impact Questionnaire (FIQ) for FMs. Plasma concentrations of inflammatory cytokines (TNF-α, IL-1β, IL-6, IL-17A and IFN-γ) were quantified via U-Plex ELISA (Meso Scale Diagnostics, USA). Peripheral blood mononuclear cells (PBMC) were isolated by standard density-gradient centrifugation (Lymphoprep™). Mid-infrared (Mid-IR) spectra were acquired from plasma and PBMC’s supernatants using a Bruker V80 Fourier-transform infrared (FTIR) spectrometer. Correlation coefficient analysis was performed to relate specific spectral features to clinical scores and cytokine levels.
Results: Spectral analysis of plasma samples generated distinct spectral “fingerprints” that reliably distinguished FMs patients from those with RA, AS and healthy controls (Fig. 1). Notably, several infrared spectral features showed strong correlations with RA disease activity (e.g., DAS28) (Fig.2) and inflammatory cytokine levels (e.g. IL-6, IL-17A), indicating that spectral markers reflect underlying inflammatory burden. Furthermore, spectral analysis of PBMC-derived supernatants from rheumatic patients, following activation (LPS/PHA) and treatment with anti-inflammatory drugs, corelated with biological data reflecting the inflammatory status of the cells (Fig. 3).
Conclusion: Integrating Mid-IR spectral profiling of liquid biopsies (such as patients-derived plasma or -immune cells’ supernatants) with established clinical and biological parameters provides a powerful, non-invasive modality for differential diagnosis and severity stratification of rheumatic diseases. This approach has the potential to improve diagnostic accuracy and guide personalized treatment strategies in rheumatology.
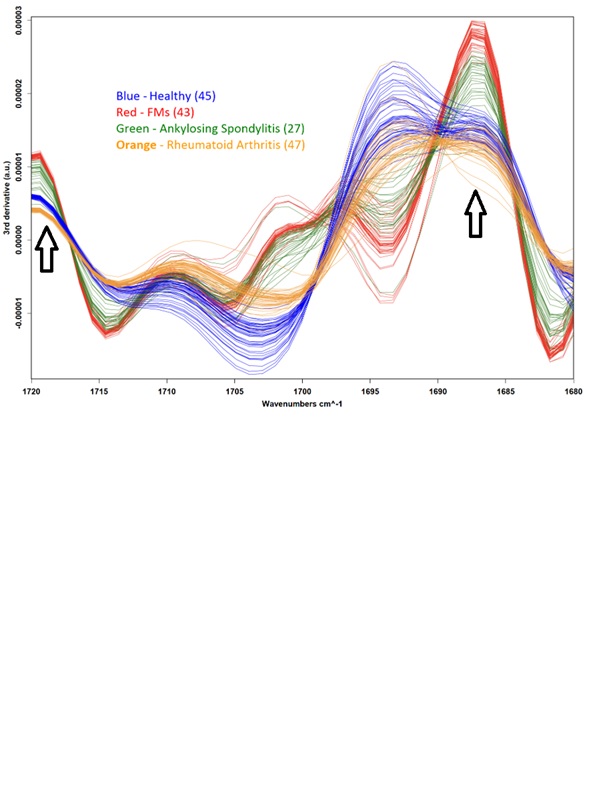 Mid-IR spectral analysis of plasma samples distinguishes fibromyalgia syndrome (FMs) patients (n=43) from other rheumatic inflammatory/autoimmune diseases: rheumatoid arthritis (n=47), ankylosing spondylitis (n=27), and healthy controls (n=45). Black arrows indicate specific optical windows where clear differentiation between the groups is observed, even to the naked eye of a rheumatologist or immunologist. The analysis considers the third derivative of the absorption data with respect to the wavenumbers (cm⁻¹).
.jpg) A significant correlation between disease activity score of RA patients and spectral data of their plasma. A parabolic relationship between the disease activity score (DAS-28, y-axis) and the spectral data (correlation coefficient in percentage, x-axis). The absorption spectra of plasma derived from RA patients were measured. The correlation coefficient between the spectra and a reference spectrum was calculated (y-axis). The reference can be the average of a healthy control group or an RA patient in remission. The results align with expectations: the closer the spectrum is to the reference (higher correlation coefficient), the healthier the patient (lower DAS28 score). r = -0.903, p value = 0.005.
A significant correlation between disease activity score of RA patients and spectral data of their plasma. A parabolic relationship between the disease activity score (DAS-28, y-axis) and the spectral data (correlation coefficient in percentage, x-axis). The absorption spectra of plasma derived from RA patients were measured. The correlation coefficient between the spectra and a reference spectrum was calculated (y-axis). The reference can be the average of a healthy control group or an RA patient in remission. The results align with expectations: the closer the spectrum is to the reference (higher correlation coefficient), the healthier the patient (lower DAS28 score). r = -0.903, p value = 0.005.
.jpg) Spectral analysis, at a specific optical window, of PBMC-derived supernatants from rheumatic patients revealed spectral peaks (black square) that correlate with the in vitro status of the cells: non-activated cells (blue curve), inflammatory activation (red curve, shifted downward compared to the blue curve), or activation plus anti-inflammatory drug (green curve, shifted back toward the blue curve). The spectral results are consistent with biological findings.
Spectral analysis, at a specific optical window, of PBMC-derived supernatants from rheumatic patients revealed spectral peaks (black square) that correlate with the in vitro status of the cells: non-activated cells (blue curve), inflammatory activation (red curve, shifted downward compared to the blue curve), or activation plus anti-inflammatory drug (green curve, shifted back toward the blue curve). The spectral results are consistent with biological findings.
To cite this abstract in AMA style:
Halpert G, Dankner Y, Govrin E, Watad A, Gendelman O, Segev S, Shoenfeld Y, Amital H. Mid‐Infrared Spectroscopy for Enhanced Diagnosis of Rheumatic Diseases [abstract]. Arthritis Rheumatol. 2025; 77 (suppl 9). https://acrabstracts.org/abstract/mid%e2%80%90infrared-spectroscopy-for-enhanced-diagnosis-of-rheumatic-diseases/. Accessed .« Back to ACR Convergence 2025
ACR Meeting Abstracts - https://acrabstracts.org/abstract/mid%e2%80%90infrared-spectroscopy-for-enhanced-diagnosis-of-rheumatic-diseases/