Session Information
Session Type: Poster Session C
Session Time: 10:30AM-12:30PM
Background/Purpose: Current clinical methods to diagnose and evaluate the severity of lupus nephritis (LN) rely on identification of kidney dysfunction followed by invasive kidney biopsies. Here, we sought to identify molecular profiles of LN in the kidney tissue that would be reflected in blood gene expression.
Methods: Gene expression was analyzed from 46 kidney biopsies for which renal disease classification had been carried out by a blinded clinical pathologist and 91 blood samples from lupus patients with or without biopsy documented LN. For blood samples from patients with LN, biopsies were taken at the time of blood draw. Each dataset was analyzed by Gene Set Variation Analysis (GSVA) for enrichment of gene modules identifying immune cells/pathways, metabolism pathways, and kidney tissue cells. Samples were clustered using k means and ordered based on ISN/RPI classification of disease involvement.
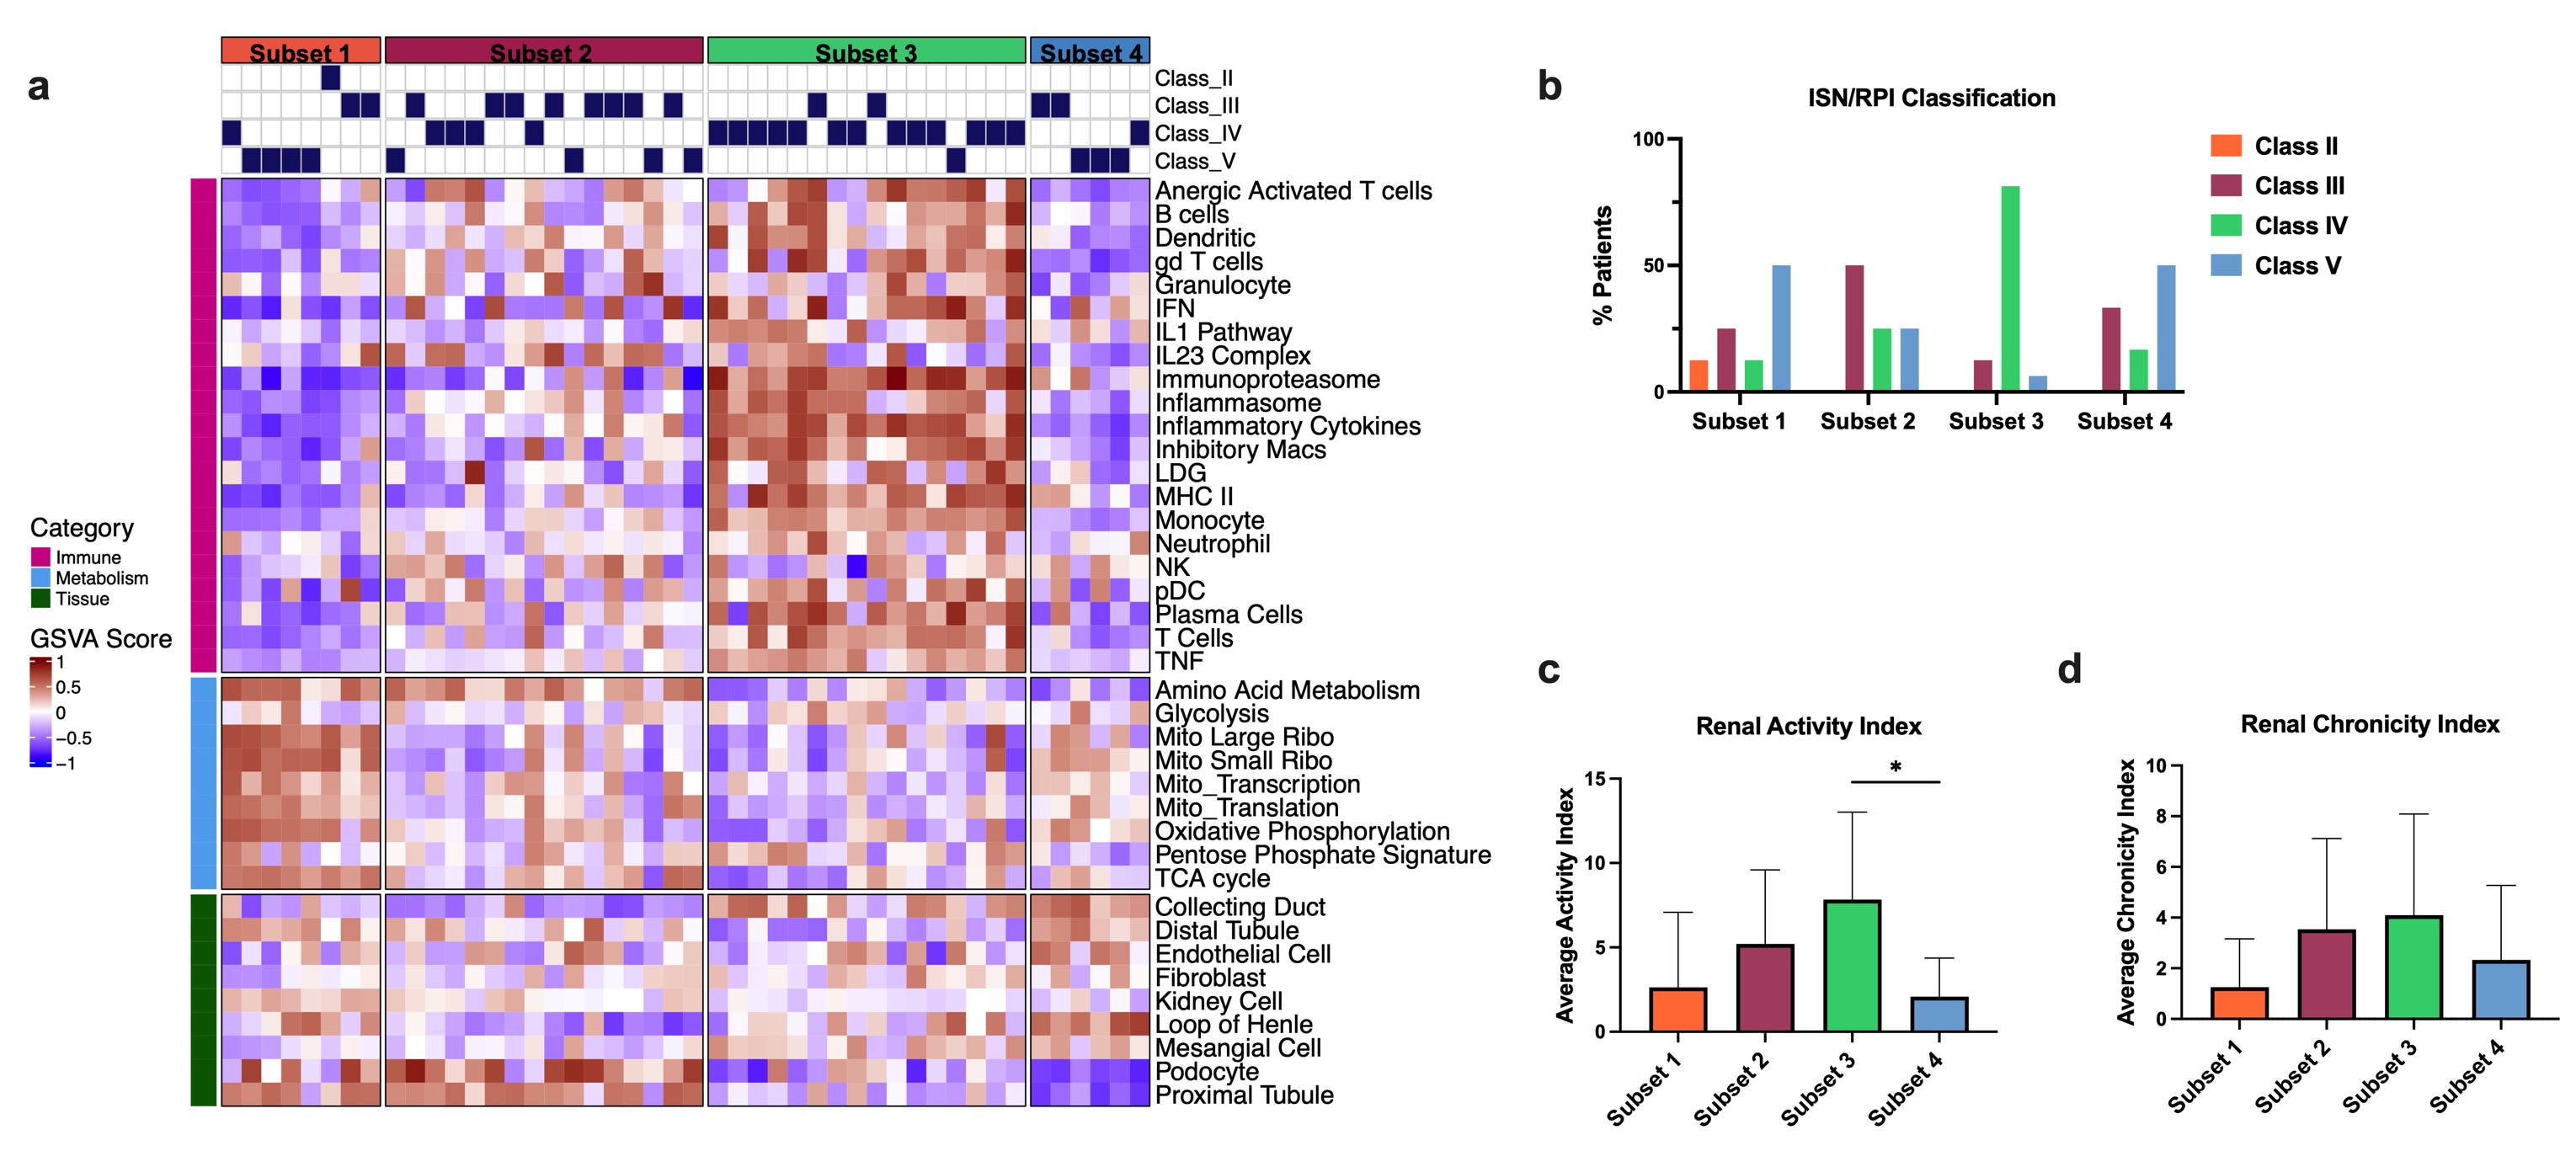
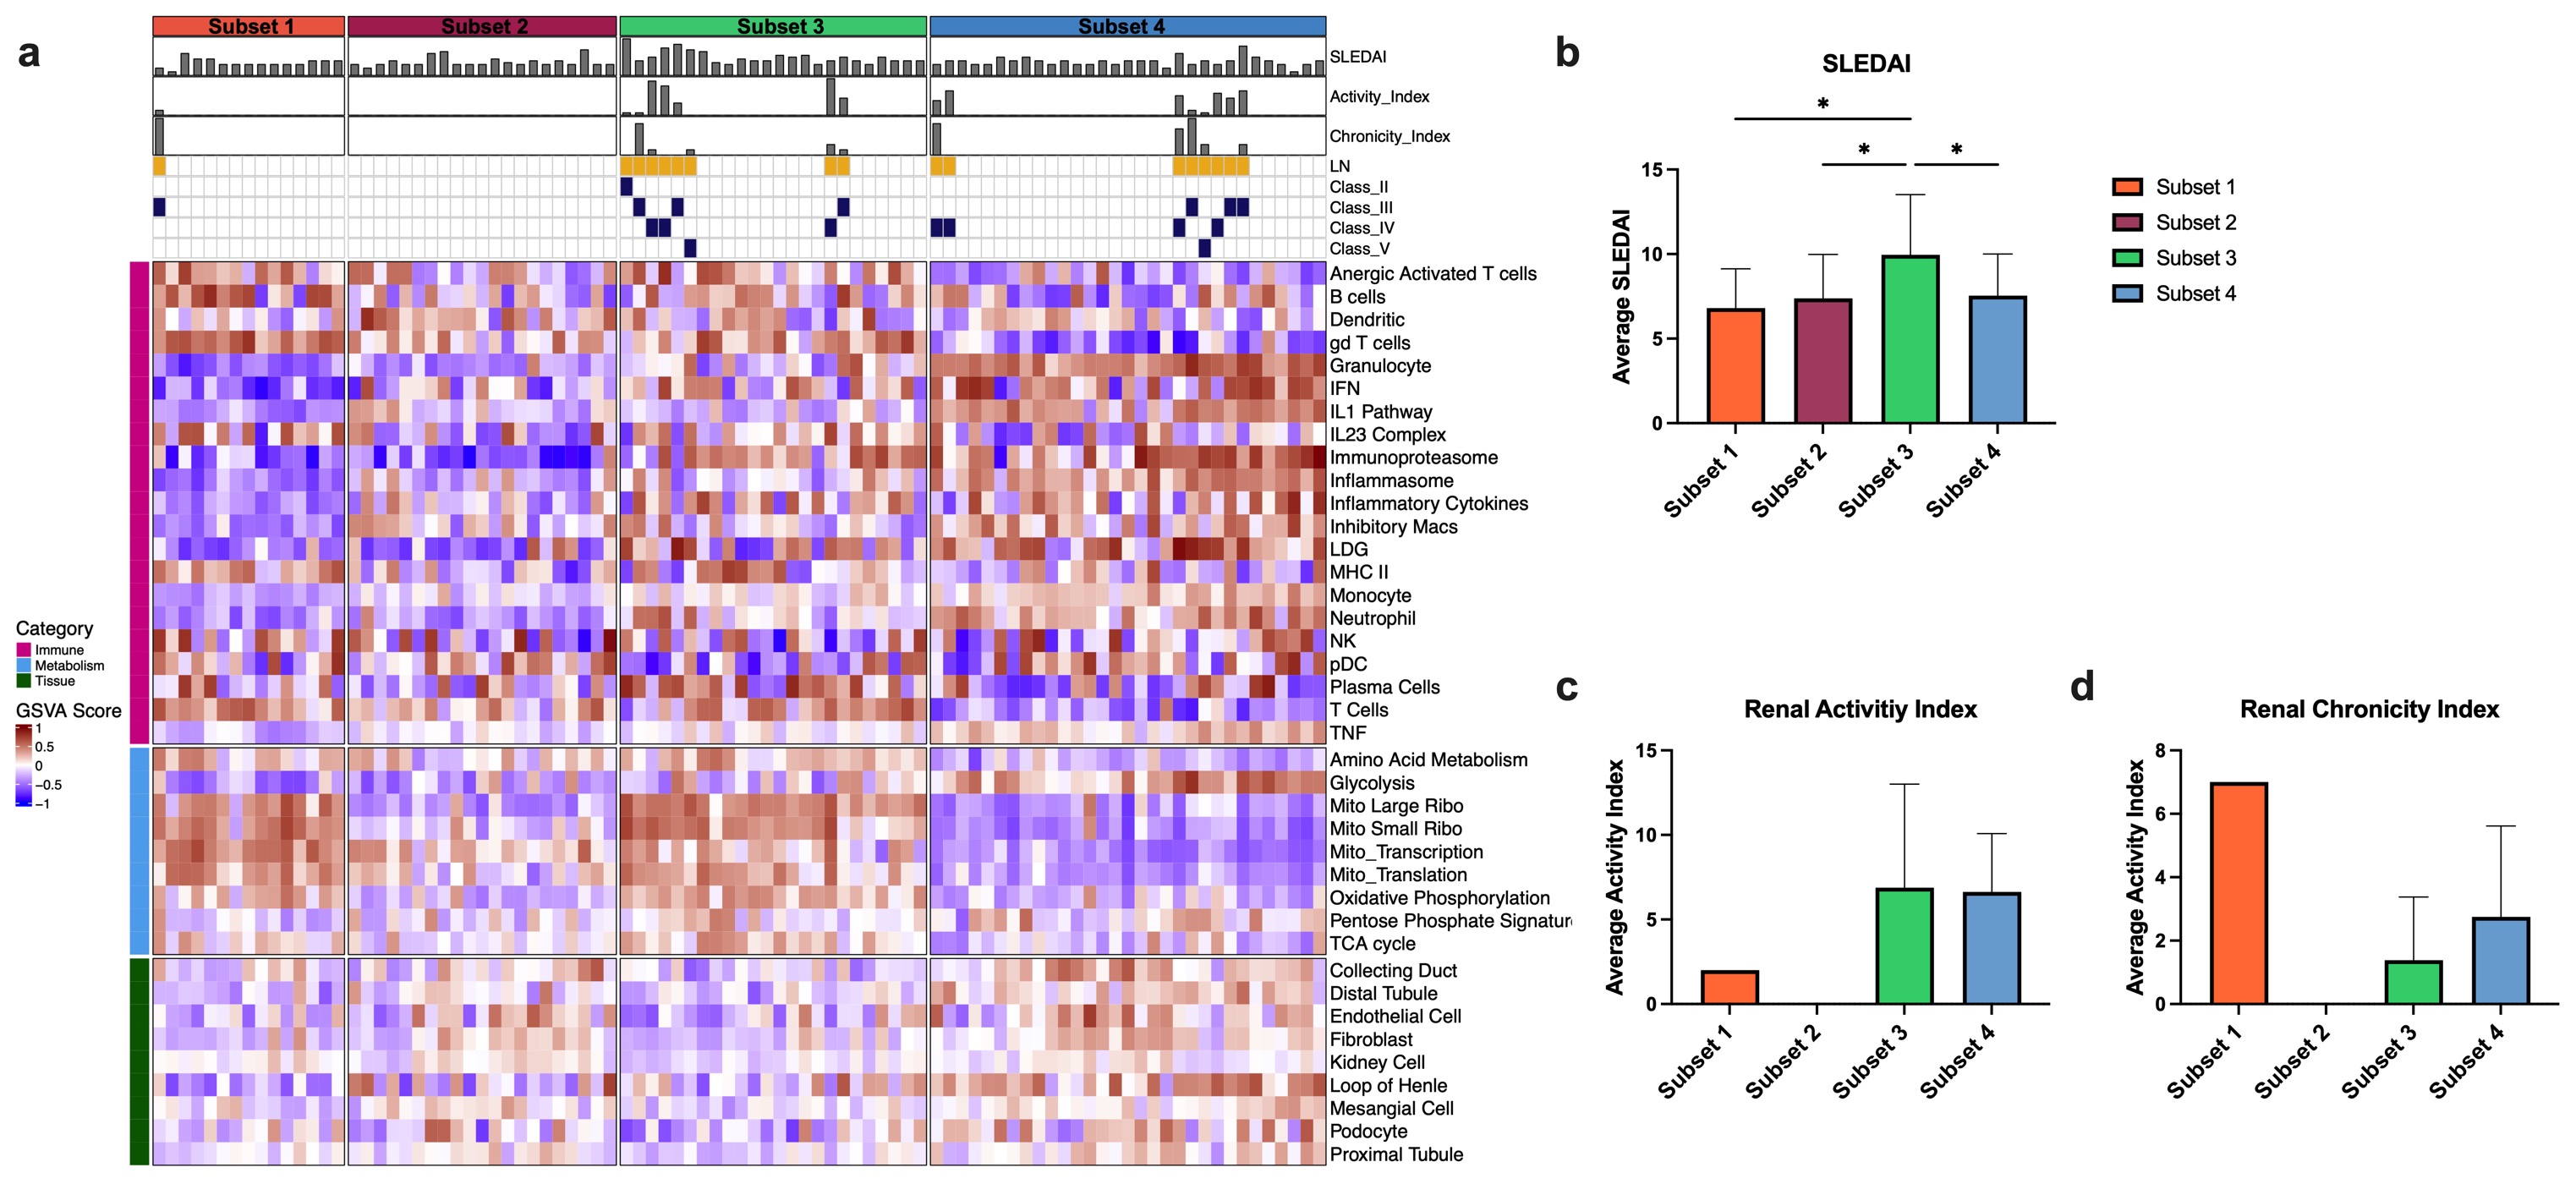
Results: GSVA and unsupervised k-means clustering of kidney tissue identified four subsets of LN (Fig. 1a). Subsets 1-3 exhibited molecular profiles indicative of increasing disease severity, including upregulation of immune/inflammatory modules, decrease in metabolism modules and decrease in kidney tissue modules. Subset 4 was characterized by de-enrichment of immune modules and restored enrichment of metabolism and kidney tissue modules, but retained a loss of the podocyte and proximal tubule gene modules indicative of a post-inflammatory state and end organ damage. The molecular profile of each subset was associated with the ISN/RPI histologic classification (Fig. 1b-d). Subset 1 was dominated by Class II mesangial LN and Class V membranous LN with low activity and chronicity indices. Subset 2 contained the majority of Class III, focal, proliferative LN patients and increased activity and chronicity indices compared to Subset 1. The most active disease cluster, Subset 3, largely consisted of Class IV, diffuse proliferative LN patients with the highest overall activity and chronicity scores. Finally, Subset 4 was dominated by Class V LN patients. Gene modules used to separate LN kidney biopsies were also able to stratify blood gene expression from lupus patients with or without LN (Fig. 2a). Blood samples from LN patients were largely in Subsets 3-4 and mean SLEDAI was significantly increased in Subset 3 (Fig. 2b). Among the LN patients, Subset 3 had the highest activity index and Subsets 1 and 4 had the highest chronicity indices (Fig. 2c-d).
Conclusion: Gene expression analysis of LN kidney biopsies revealed four subsets with distinct profiles of gene module enrichment indicative of immune involvement, metabolic dysfunction, and tissue damage that aligned with histologic class. Although there was greater heterogeneity between subsets in the blood as compared to the kidney, distinct gene profiles associated with higher disease severity and LN activity were identified.
To cite this abstract in AMA style:
Daamen A, Kingsmore K, Bachali P, Shen N, Grammer A, Lipsky P. Linking Transcriptomic Profiles of Kidney and Blood Samples Provides Insight into Identification of Lupus Nephritis [abstract]. Arthritis Rheumatol. 2024; 76 (suppl 9). https://acrabstracts.org/abstract/linking-transcriptomic-profiles-of-kidney-and-blood-samples-provides-insight-into-identification-of-lupus-nephritis/. Accessed .« Back to ACR Convergence 2024
ACR Meeting Abstracts - https://acrabstracts.org/abstract/linking-transcriptomic-profiles-of-kidney-and-blood-samples-provides-insight-into-identification-of-lupus-nephritis/


