Session Information
Date: Monday, November 8, 2021
Session Type: Poster Session C
Session Time: 8:30AM-10:30AM
Background/Purpose: Obesity is associated with poor response to treatment in patients with psoriatic arthritis (PsA), however, available data are mostly focused on tumor necrosis factor inhibitor (TNFi) initiators with only a few studies that have examined this association with initiators of other therapies. There are even fewer studies with patient reported outcome (PRO) measures as the outcomes of interest in PsA treatment. The clinical Disease Activity Index for Psoriatic Arthritis (cDAPSA) is a composite measure of disease activity in PsA and the, Routine Assessment of Patient Index Data 3 (RAPID3) and Psoriatic Arthritis Impact of Disease (PsAID) are PROs used in PsA. We examined the association of obesity with change in cDAPSA, RAPID3, PsAID among patients with PsA initiating TNFi, interleukin 17 inhibitors (IL17i) and oral small molecules (OSM).
Methods: Patients with PsA were enrolled in the Psoriatic Arthritis Research Consortium longitudinal cohort study in the US between 2016-2020, initiated therapy with either TNFi, IL17i or OSM and completed at least one follow up visit. Treatment response was assessed by change in cDAPSA, RAPID3, or PsAID. Patients were stratified based on body mass index category (normal weight = BMI 19 to < 25 kg/m2, overweight = BMI 25 to < 30 kg/m2, obese = BMI ≥ 30 kg/m2). Baseline characteristics were reported descriptively. BMI category and its association with change in the outcomes of interest was examined in univariable and age-and-sex adjusted linear regression models.
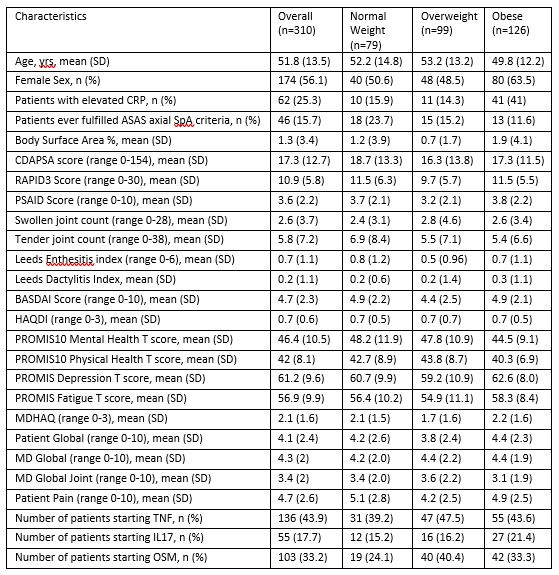
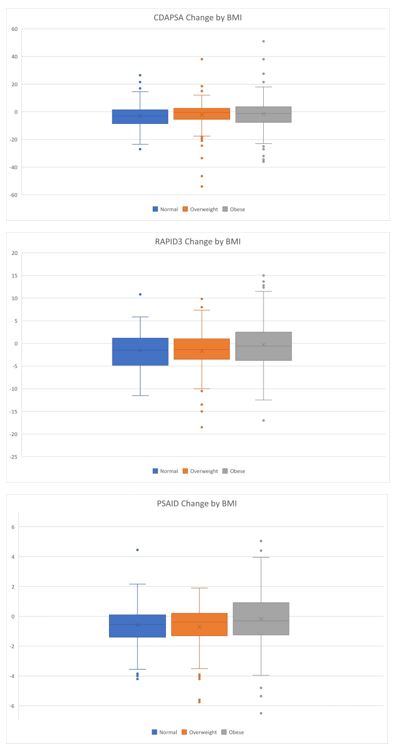
Results: A total of 310 patients were included in the analysis. The mean age of patients was 52 and 56% were female. At baseline, the mean cDAPSA was 17.3 (SD 12.7), the mean PsAID was 3.6 (SD 2.2), the mean RAPID3 was 10.9 (SD 5.8). Baseline scores were overall similar when stratified by BMI category (Table 1). The mean change in cDAPSA was lowest among obese patients (-2.91 (SD 9.56) in normal BMI, -2.29 (SD 11.48) in overweight BMI, and -1.42 (SD 12.33) in obese BMI). The mean change in RAPID3 was lowest among obese patients (-1.53 (SD 4.50) in normal BMI, -1.69 (SD 4.47) in overweight BMI, and -0.26 (SD 5.46) in obese BMI). The mean change in PsAID was lowest among obese patients (-0.58 (SD 1.48) in normal weight BMI, -0.72 (SD 1.47) in overweight BMI, and -0.17 (SD 1.98) in obese BMI) (Figure 1). These differences were not statistically significant, potentially due to sample size. In unadjusted and age-and-sex adjusted analyses (Table 2), compared to the normal BMI category, obese patients had less improvement in cDAPSA, RAPID3 and PsAID. Similar numerical reduction in improvement was also found in the TNFi initiators although there was not a stepwise decrease in improvement with increasing BMI in IL17i nor OSM initiators.
Conclusion: The mean change in the selected outcome measures (cDAPSA, RAPID3, PsAID) was lowest among obese patients compared to the other BMI categories. Interestingly, this pattern was observed primarily among TNFi initiators as opposed to OSM or IL17i initiators.
 Table 1: Baseline Characteristics Overall and by BMI Category. Normal weight (BMI 19 to < 25 kg/m2), Overweight (BMI 25 to < 30 kg/m2), Obese (BMI ≥30 kg/m2)
 Figure 1 Change in Patient Reported Outcomes by BMI Category. The mean change in cDAPSA was lowest among obese patients (_2.91 (SD 9.56) in normal BMI, _2.29 (SD 11.48) in overweight BMI, and _1.42 (SD 12.33) in obese BMI, p value 0.38). The mean change in RAPID3 was lowest among obese patients (_1.53 (SD 4.50) in normal BMI, _1.69 (SD 4.47) in overweight BMI, and -0.26 (SD 5.46) in obese BMI, p value 0.12). The mean change in PsAID was lowest among obese patients (-0.58 (SD 1.48) in normal weight BMI, -0.72 (SD 1.47) in overweight BMI, and -0.17 (SD 1.98) in obese BMI, p value 0.24)
 Table 2: Univariate and Age/Sex Adjusted Linear Regression Analysis. Beta-coefficients are interpreted as the difference in change in the outcome among the overweight group compared to the normal weight group and the obese group compared to the normal weight group. In other words, a beta-coefficient of 1.48 means that the obese group had 1.48 units less improvement than the normal BMI group (as the normal group was negative (improved), the obese group improved less). Abbreviations: TNFi = tumor necrosis factor inhibitor; IL17i = interleukin 17 inhibitor; OSM = oral small molecule
To cite this abstract in AMA style:
Purcell E, Reddy S, Walsh J, Scher J, Craig E, Husni E, Ogdie A. Impact of BMI on Treatment Response Among PsA Patients Initiating TNF Inhibitors, IL17 Inhibitors and Oral Small Molecules [abstract]. Arthritis Rheumatol. 2021; 73 (suppl 9). https://acrabstracts.org/abstract/impact-of-bmi-on-treatment-response-among-psa-patients-initiating-tnf-inhibitors-il17-inhibitors-and-oral-small-molecules/. Accessed .« Back to ACR Convergence 2021
ACR Meeting Abstracts - https://acrabstracts.org/abstract/impact-of-bmi-on-treatment-response-among-psa-patients-initiating-tnf-inhibitors-il17-inhibitors-and-oral-small-molecules/
