Session Information
Date: Tuesday, October 28, 2025
Title: (2377–2436) Systemic Lupus Erythematosus – Diagnosis, Manifestations, & Outcomes Poster III
Session Type: Poster Session C
Session Time: 10:30AM-12:30PM
Background/Purpose: Polygenic risk scores (PRS) quantify an individual’s genetic susceptibility to diseases by integrating genotype data across multiple loci. However, conventional PRS are limited in capturing the biological context of risk variants. Here, we applied a novel approach, cell-type PRS (csPRS) and pathway-specific PRS (psPRS), to assess genetic risk variants related to specific immune pathways associated with lupus nephritis (LN) phenotypes in childhood-onset SLE (cSLE).
Methods: The study cohort included 192 patients diagnosed with SLE before the age of 18, recruited from the University of Texas Southwestern Medical Center. Demographic and clinical phenotypes were collected during routine clinic visits. A total of 952 SLE risk variants were utilized based on an autoimmune multi-ancestry meta-GWAS. Using chromatin accessibility data, the variants were categorized by immune cell type – B cells, T cells, monocytes, and NK cells – and, using KEGG pathway annotation, the variants were grouped into four biological pathways – BCR, TLR, JAK-STAT, and MAPK. csPRS and psPRS were calculated using a high-performance PRS model (Pruning + Thresholding; p-value threshold: 5 × 10⁻⁴; AUC > 0.7). To evaluate differences in csPRS and psPRS based on the presence of LN and classes (class I/II, proliferative [III, IV, III+V, IV+V], and membranous), ANOVA followed by post-hoc analysis were performed to assess group-wise differences. Overlap of SNP sets between pathways and immune cell types was visualized using R. Pearson correlation coefficients were calculated to assess the relationship between csPRS and psPRS.
Results: The majority of cSLE patients (63.5%) were classified genetically as admixed ancestry, followed by African ancestry (19.7%). There was no difference in overall PRS between patients with and without LN. Further analysis comparing csPRS and psPRS across LN classes showed that patients with proliferative LN had numerically higher T cell PRS than those with class I/II LN, while MAPK psPRS was significantly elevated in the proliferative group (p = 0.016). To assess the combined contribution of specific immune cell types and pathways, an integrated PRS was calculated. T cell + MAPK PRS revealed a significant difference between class I/II and proliferative LN (p = 0.021). To ensure the result was not driven by overlapping variants, the two SNPs shared between the T cell and MAPK sets were removed prior to computing the integrated score. Notably, there was no significant correlation between T cell and MAPK PRS.
Conclusion: This study demonstrated the heterogeneity of genetic risk across immune pathways in cSLE. Applying csPRS and psPRS, we identified distinct immunogenetic signatures that may underlie differences between class I/II and proliferative LN, reflecting potential immunopathological distinctions between LN histologic subtypes. Expanding this approach in larger, ancestrally diverse cohorts will be essential to validate findings and improve patient stratification into biologically meaningful endotypes. Ultimately, this framework may inform the identification of key immune pathways driving disease phenotypes and support the development of targeted therapies in cSLE.
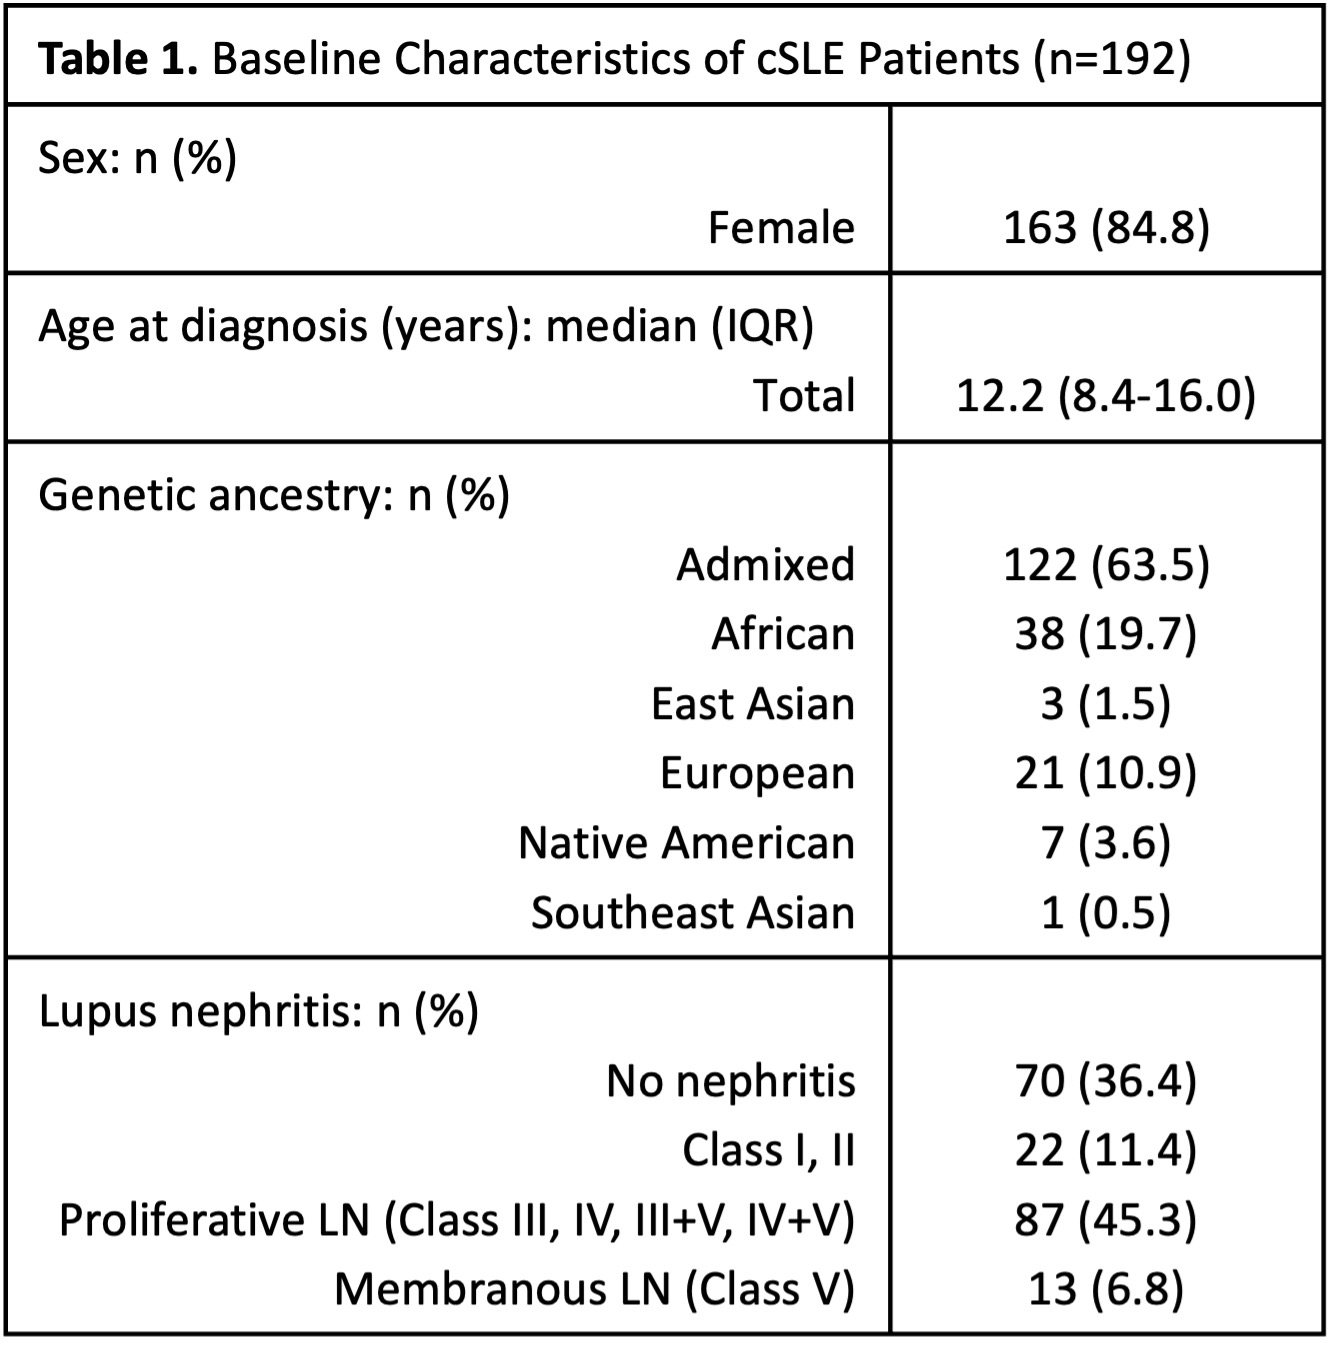 Ancestry was determined using ADMIXTURE analysis. Patients were assigned to a specific ancestry group if their first principal component (PC1) exceeded an 80% threshold; otherwise, they were classified as admixed.
.jpg) Comparison of csPRS and psPRS in cSLE patients with and without lupus nephritis, using t-test. (A) Immune csPRS (B cell, monocyte, NK cell, and T cell) in cSLE patients with lupus nephritis (n=122) versus those without lupus nephritis (n=70). (B) psPRS (BCR, JAK-STAT, MAPK, and TLR signaling pathways) in the same patient groups.
Comparison of csPRS and psPRS in cSLE patients with and without lupus nephritis, using t-test. (A) Immune csPRS (B cell, monocyte, NK cell, and T cell) in cSLE patients with lupus nephritis (n=122) versus those without lupus nephritis (n=70). (B) psPRS (BCR, JAK-STAT, MAPK, and TLR signaling pathways) in the same patient groups.
.jpg) Comparison of csPRS and psPRS across lupus nephritis classes. Lupus nephritis classes were grouped as class I/II, proliferative lupus nephritis (classes III, IV, III+V, IV+V), and membranous lupus nephritis (class V) (A) T cell PRS was compared across lupus nephritis classes using ANOVA followed by post-hoc tests. (B–C) MAPK PRS and the integrated T cell + MAPK PRS were analyzed using the same approach as described for T cell PRS. (D) SNP set overlaps across pathways and immune cell types were visualized using an UpSet plot in R. “Set Size” indicates the number of SNPs in each category (e.g., T cell, B cell, MAPK, TLR), while “Intersection Size” shows the number of SNPs shared between sets. Intersections represent overlapping SNPs or pathways between sets, with each intersection corresponding to a shared subset. (E) Pearson correlation coefficients were calculated to the relationship between csPRS and psPRS. * indicates p ≤ 0.05; ns indicates not statistically significant.
Comparison of csPRS and psPRS across lupus nephritis classes. Lupus nephritis classes were grouped as class I/II, proliferative lupus nephritis (classes III, IV, III+V, IV+V), and membranous lupus nephritis (class V) (A) T cell PRS was compared across lupus nephritis classes using ANOVA followed by post-hoc tests. (B–C) MAPK PRS and the integrated T cell + MAPK PRS were analyzed using the same approach as described for T cell PRS. (D) SNP set overlaps across pathways and immune cell types were visualized using an UpSet plot in R. “Set Size” indicates the number of SNPs in each category (e.g., T cell, B cell, MAPK, TLR), while “Intersection Size” shows the number of SNPs shared between sets. Intersections represent overlapping SNPs or pathways between sets, with each intersection corresponding to a shared subset. (E) Pearson correlation coefficients were calculated to the relationship between csPRS and psPRS. * indicates p ≤ 0.05; ns indicates not statistically significant.
To cite this abstract in AMA style:
Kim L, Fernandez-Salinas D, Villanueva Martin G, Aguiar V, Lewandowski L, Vogel T, Vinuesa C, Hiraki L, Wright T, Pascual V, Chang J, Gutierrez-Arcelus M, Nigrovic P. Immune Cell/Pathway-Specific Polygenic Risk Scores Reveal Immune Pathway Associations in Childhood-Onset Lupus Nephritis [abstract]. Arthritis Rheumatol. 2025; 77 (suppl 9). https://acrabstracts.org/abstract/immune-cell-pathway-specific-polygenic-risk-scores-reveal-immune-pathway-associations-in-childhood-onset-lupus-nephritis/. Accessed .« Back to ACR Convergence 2025
ACR Meeting Abstracts - https://acrabstracts.org/abstract/immune-cell-pathway-specific-polygenic-risk-scores-reveal-immune-pathway-associations-in-childhood-onset-lupus-nephritis/