Session Information
Date: Sunday, November 17, 2024
Title: SpA Including PsA – Diagnosis, Manifestations, & Outcomes Poster II
Session Type: Poster Session B
Session Time: 10:30AM-12:30PM
Background/Purpose: Radiographs and MRI are both used to diagnose axial spondyloarthritis (axSpA) but they also provide information about morphological and even biomechanical changes in the spinal components. The natural course of degenerative lesions (DLs) in the spine over a long period of observation has not been established in a large group of patients with axSpA. Moreover, it is not well-known which factors are associated with faster progression. Our aim was to investigate the evolution of spinal DLs in axSpA patients over 10 years (10Y) and the factors associated with progression.
Methods: Cervical and lumbar spine radiographs and whole spine MRI at baseline, 5Y and 10Y of patients diagnosed with axSpA in the DESIR cohort were assessed for DLs by three central readers blinded to timepoint and to clinical, laboratory or any other imaging information1. Patients with available imaging (radiographs or MRI) at ≥1 time point were included. DLs were defined at patient level and, for descriptive purposes, in consensus across central readers (≥2 out of 3 readers or average, as appropriate). To assess progression of DLs of both imaging modalities (Table 1) over time, we used multilevel generalised estimating equation (GEE) models considering individual reader data and exchangeable working correlation structure to handle repeated observations over time for each DL. The main variable of interest was time to reflect the annual progression of each lesion. Models were adjusted for sex, HLA-B27 status, BMI, smoking (ever vs never) and job type (no professional activity, white or blue collar) at baseline and biologic therapy exposure (ever vs never) during the 10Y period. Annual change percentage or β-coefficients and 95% confidence intervals (95%CI) were reported.
Results: DLs were available for 330 patients (mean age [SD] 34.5 [8.6] years; 47% men) (Figure 1). There was a mean (SD) of 1.6 (2.5) DLs per patient at baseline on radiographs; this number increased to 3.4 (3.9) at 10Y. On MRI, there was a mean of 7.5 (5.5) DLs per patient at baseline and 11.0 (7.1) at 10Y . A significant progression was mainly detected on radiographs for osteophytes (annual change=2.2%, 95%CI: 1.9-2.7), disc height loss (1.4%, 0.9-1.8), and facet joint osteoarthritis (1.3%, 0.9-1.7). The same trend was detected on MRI for disc protrusion (1.1%, 0.6-1.6), Modic type I (1.0%, 0.7-1.3) and II (0.9%, 0.7-1.2) (Table 1). We observed a statistically significant increase in the number of DLs on radiographs (β=1.8, 95%CI: 1.5-2.1) and MRI (4.2, 3.5-4.8). Factors associated with DLs progression in both imaging modalities were increasing BMI (0.2, 0.1-0.2 on radiographs; 0.4, 0.3-0.4 on MRI) and biologic exposure (0.4, 0.1-0.7 on radiographs; 0.9, 0.3-1.5 on MRI) (Table 2).
Conclusion: In an inception cohort of axSpA degenerative spinal lesions, though common, progress very slowly over 10Y, both on radiographs and MRI. However, this progression appears to be faster in patients with a higher BMI and those exposed to bDMARDs, which likely indicates a more severe form of axSpA.
Reference: 1. de Bruin F et al. RMD Open. 2018;4(1):e000657.
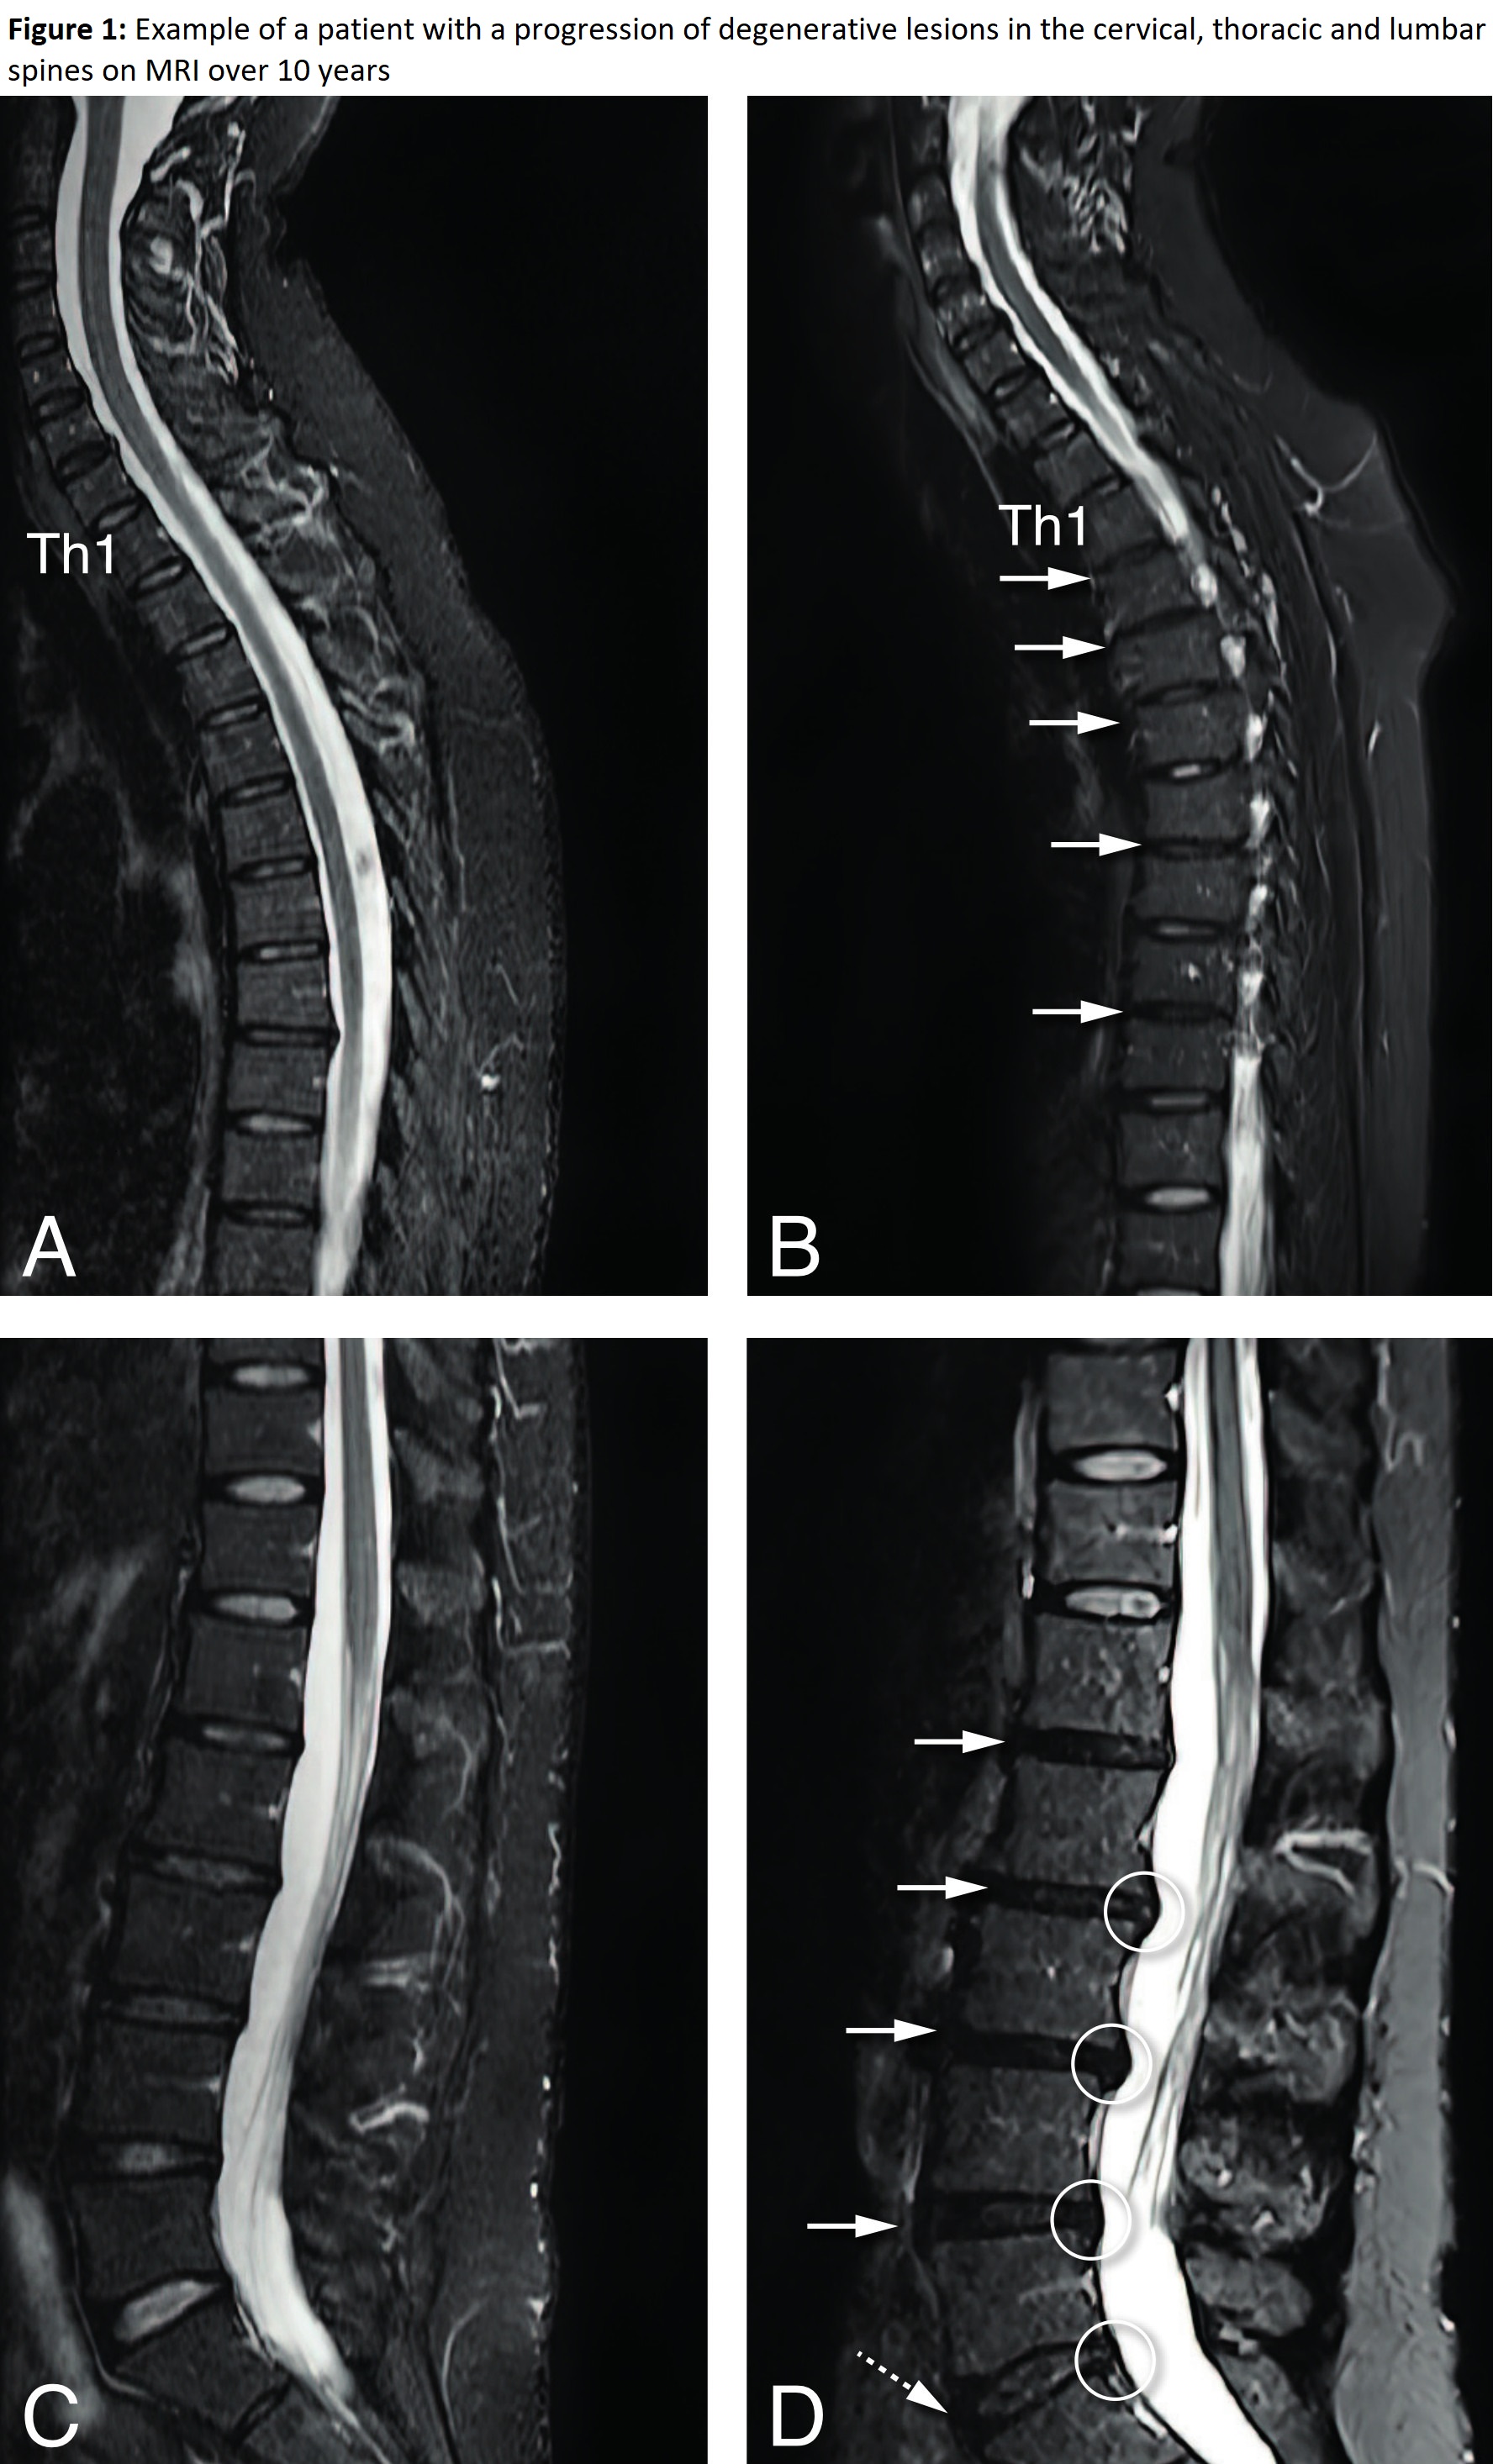
Pannels A and B: Full arrows indicate a decrease in the height of the intervertebral disc spaces at multiple levels with decrease of the signal of the discs Th1-Th4, Th5-Th6 and Th7-Th8 (from grade II to grade IV of Pfirrmann classification).
Pannels C and D: The arrows indicate progressive disc degeneration at all lumbar levels with discs L1-L5 from grade III to grade IV of Pfirrmann classification (full arrows), and L5-S1 from grade II to grade III of Pfirrmann classification (dotted arrow). Circles indicate disc protrusions.
Disc degeneration was scored on a five-point scale (Pfirrmann classification), combining signal loss and loss of height of the intervertebral discs on STIR images, and was defined as a disc with a Pfirrmann classification >2.
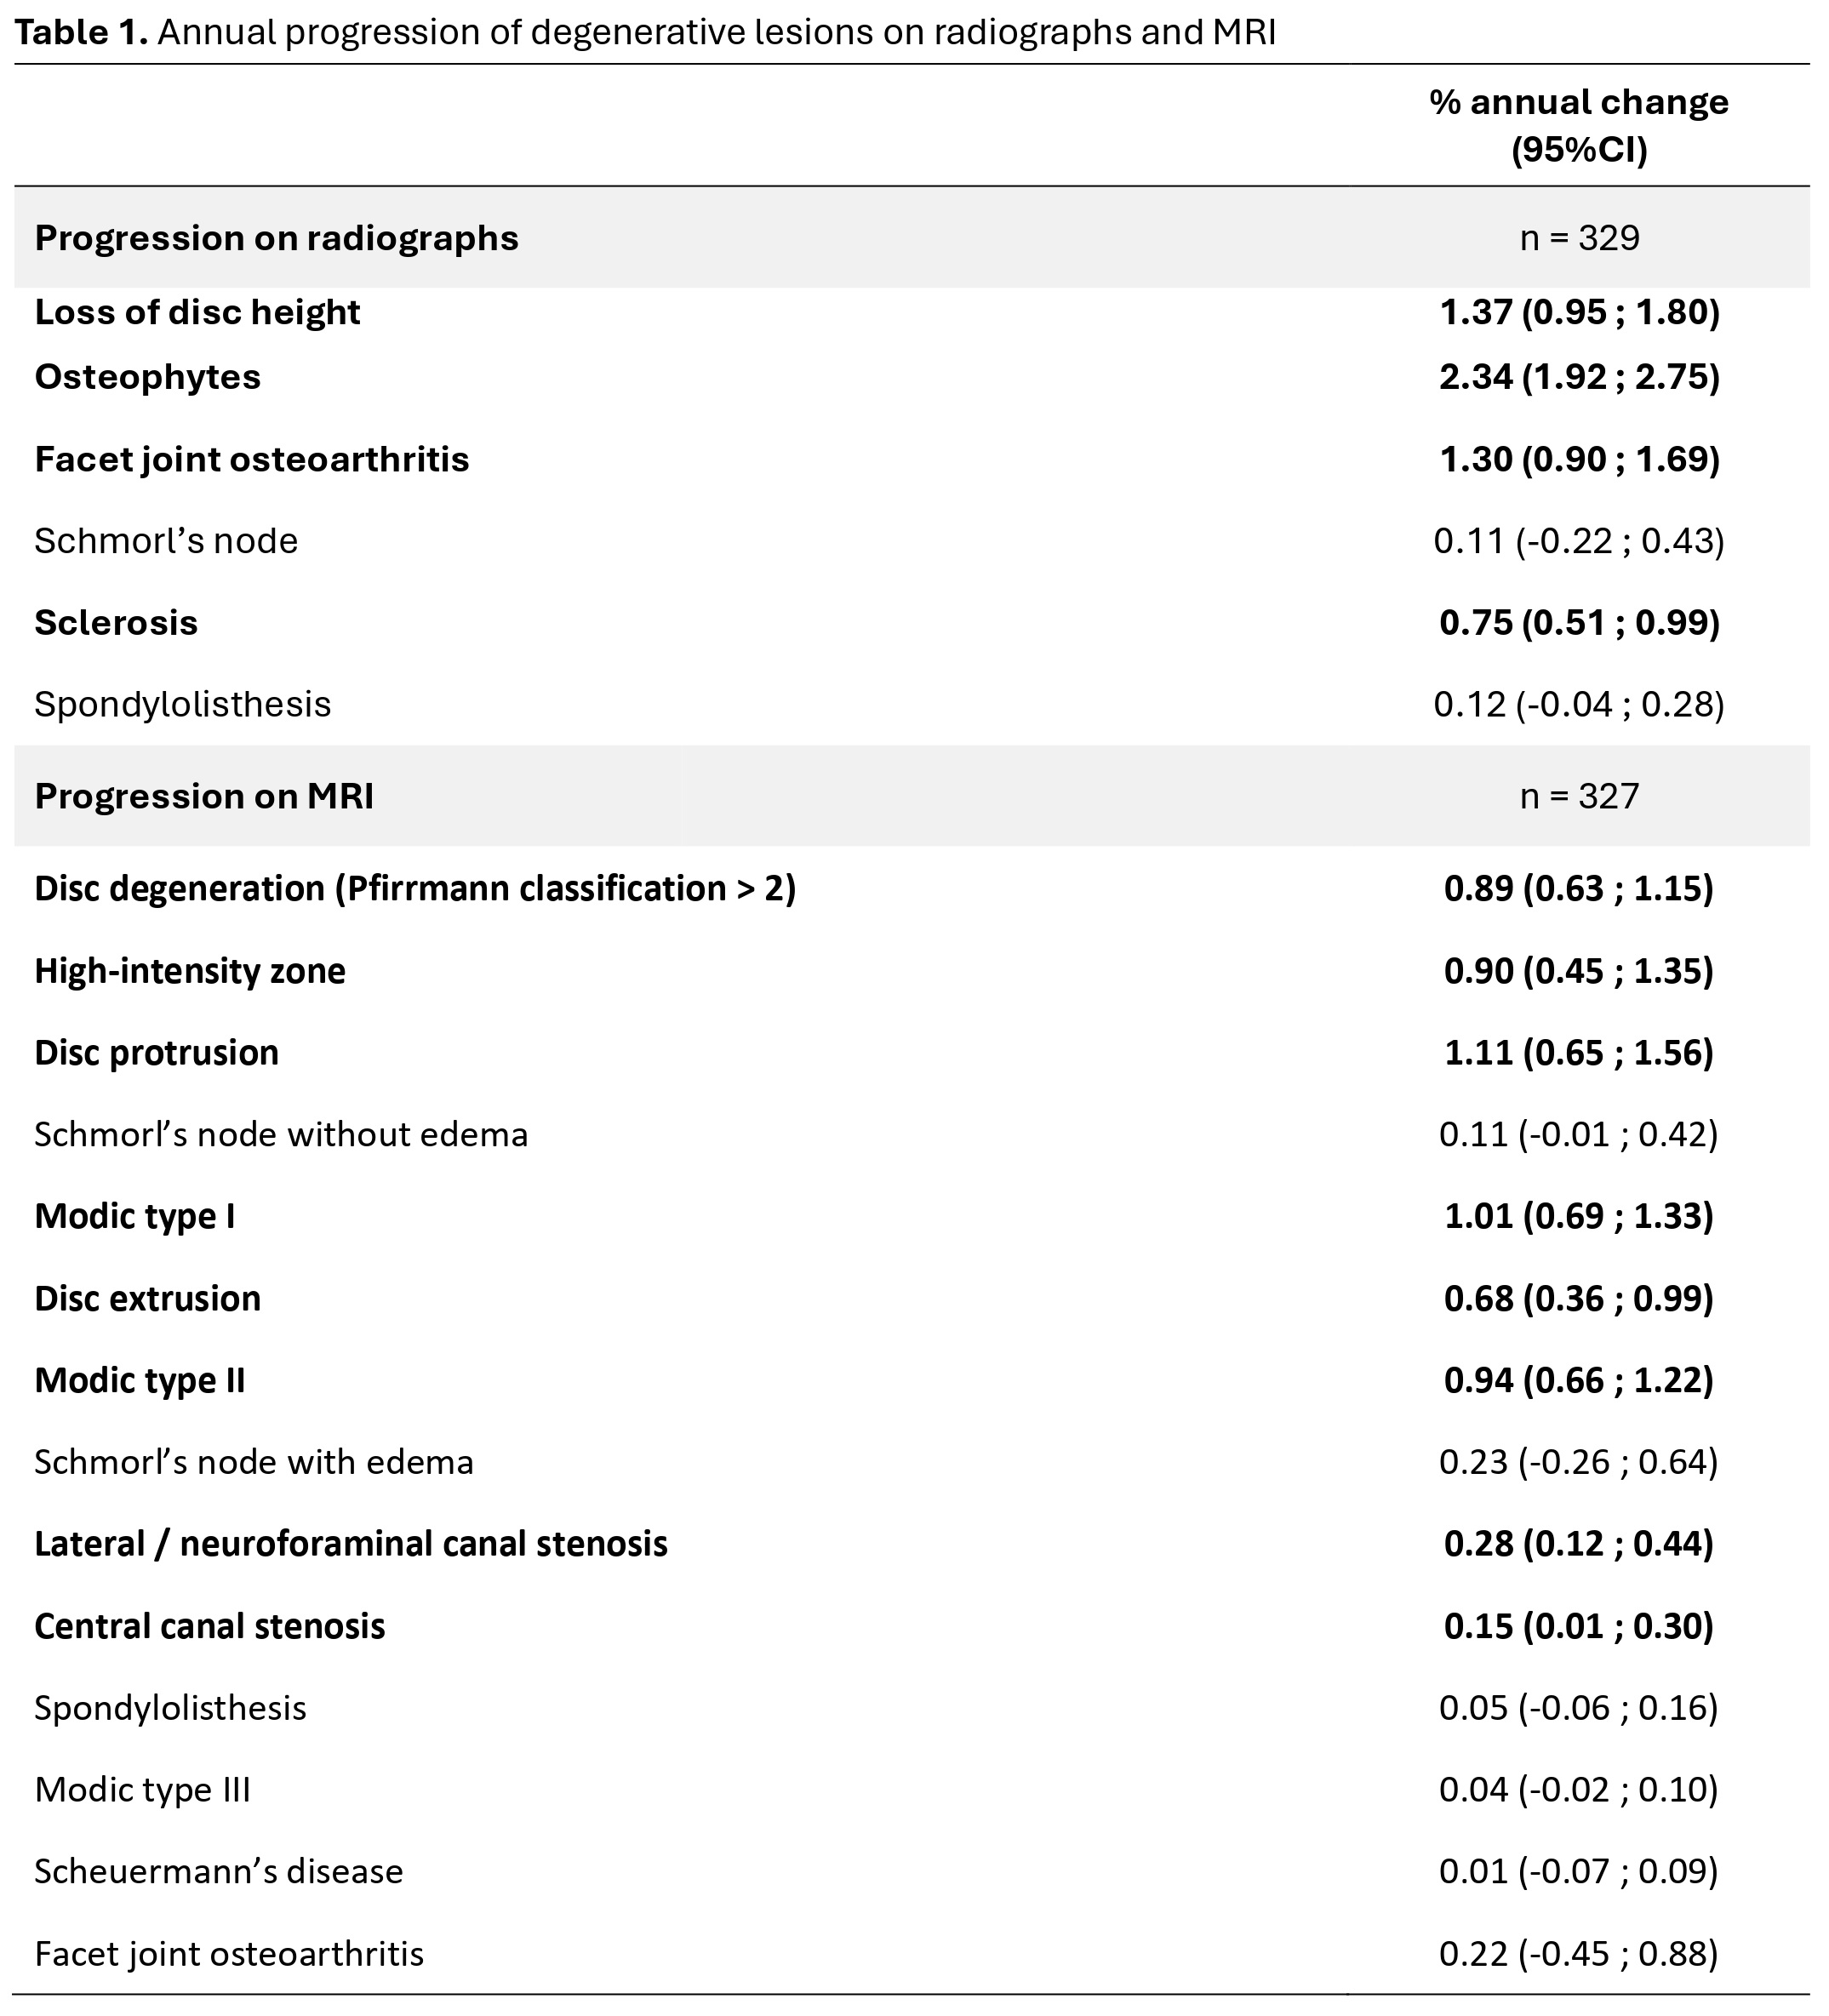
Loss of disc height was defined as narrowing of the disc space in comparison with two adjacent (healthy) discs. Osteophytes were described by reactive bone hypertrophy, seen as bony spurs arising from the vertebral body close to the vertebral endplate in a horizontal configuration (maximum of 45-degree angle with the endplate). Facet joint osteoarthritis was defined as sclerotic joint surfaces and osteophyte formation. Schmorl’s nodes were defined as a radiolucent contour defect of the vertebral endplate with sclerotic margins. Sclerosis was defined by an increased bone density and calcification adjacent to the vertebral endplates. Spondylolisthesis was defined as the slippage of one vertebral body with respect to the adjacent vertebral body.
Disc degeneration was scored on a five-point scale (Pfirrmann classification), combining signal loss and loss of height of the intervertebral discs on STIR images. The high-intensity zone, indicating an annular tear or fissure, is seen as an area of high signal intensity located in the posterior annulus fibrosis on STIR images. We considered bulging of a disc as either protrusion or extrusion; the distinction is based on whether the maximal diameter in any direction is at the base of the displacement (protrusion) or not (extrusion). Schmorl’s nodes were defined as an indentation of the (cranial or caudal) endplate with herniation of intervertebral disc material into the vertebra, with or without oedema. We used the Modic classification to assess degenerative lesions of the vertebral endplates. This is a three-point scale with type I defined as bone marrow oedema, type II is described as fatty changes and type III as sclerotic changes. Canal stenosis was defined as reduction of the anterior–posterior diameter of the spinal canal with compression on the spinal cord (at cervical and thoracic level) or as contact between the nerve root and disc material with obliteration of perineural intraforaminal fat or compression of the nerve root (at lumbar level). Spondylolisthesis was defined as the slippage of one vertebral body with respect to the adjacent vertebral body. Scheuermann’s disease was defined as abnormal and excessive curvature of the spin with anterior wedging of greater than or equal to 5 degrees in 3 or more adjacent vertebral bodies.Facet joint osteoarthritis was defined as sclerotic joint surfaces and osteophyte formation.
Bold characters indicate significant values. MRI: magnetic resonance imaging; 95%CI: 95% confidence interval.
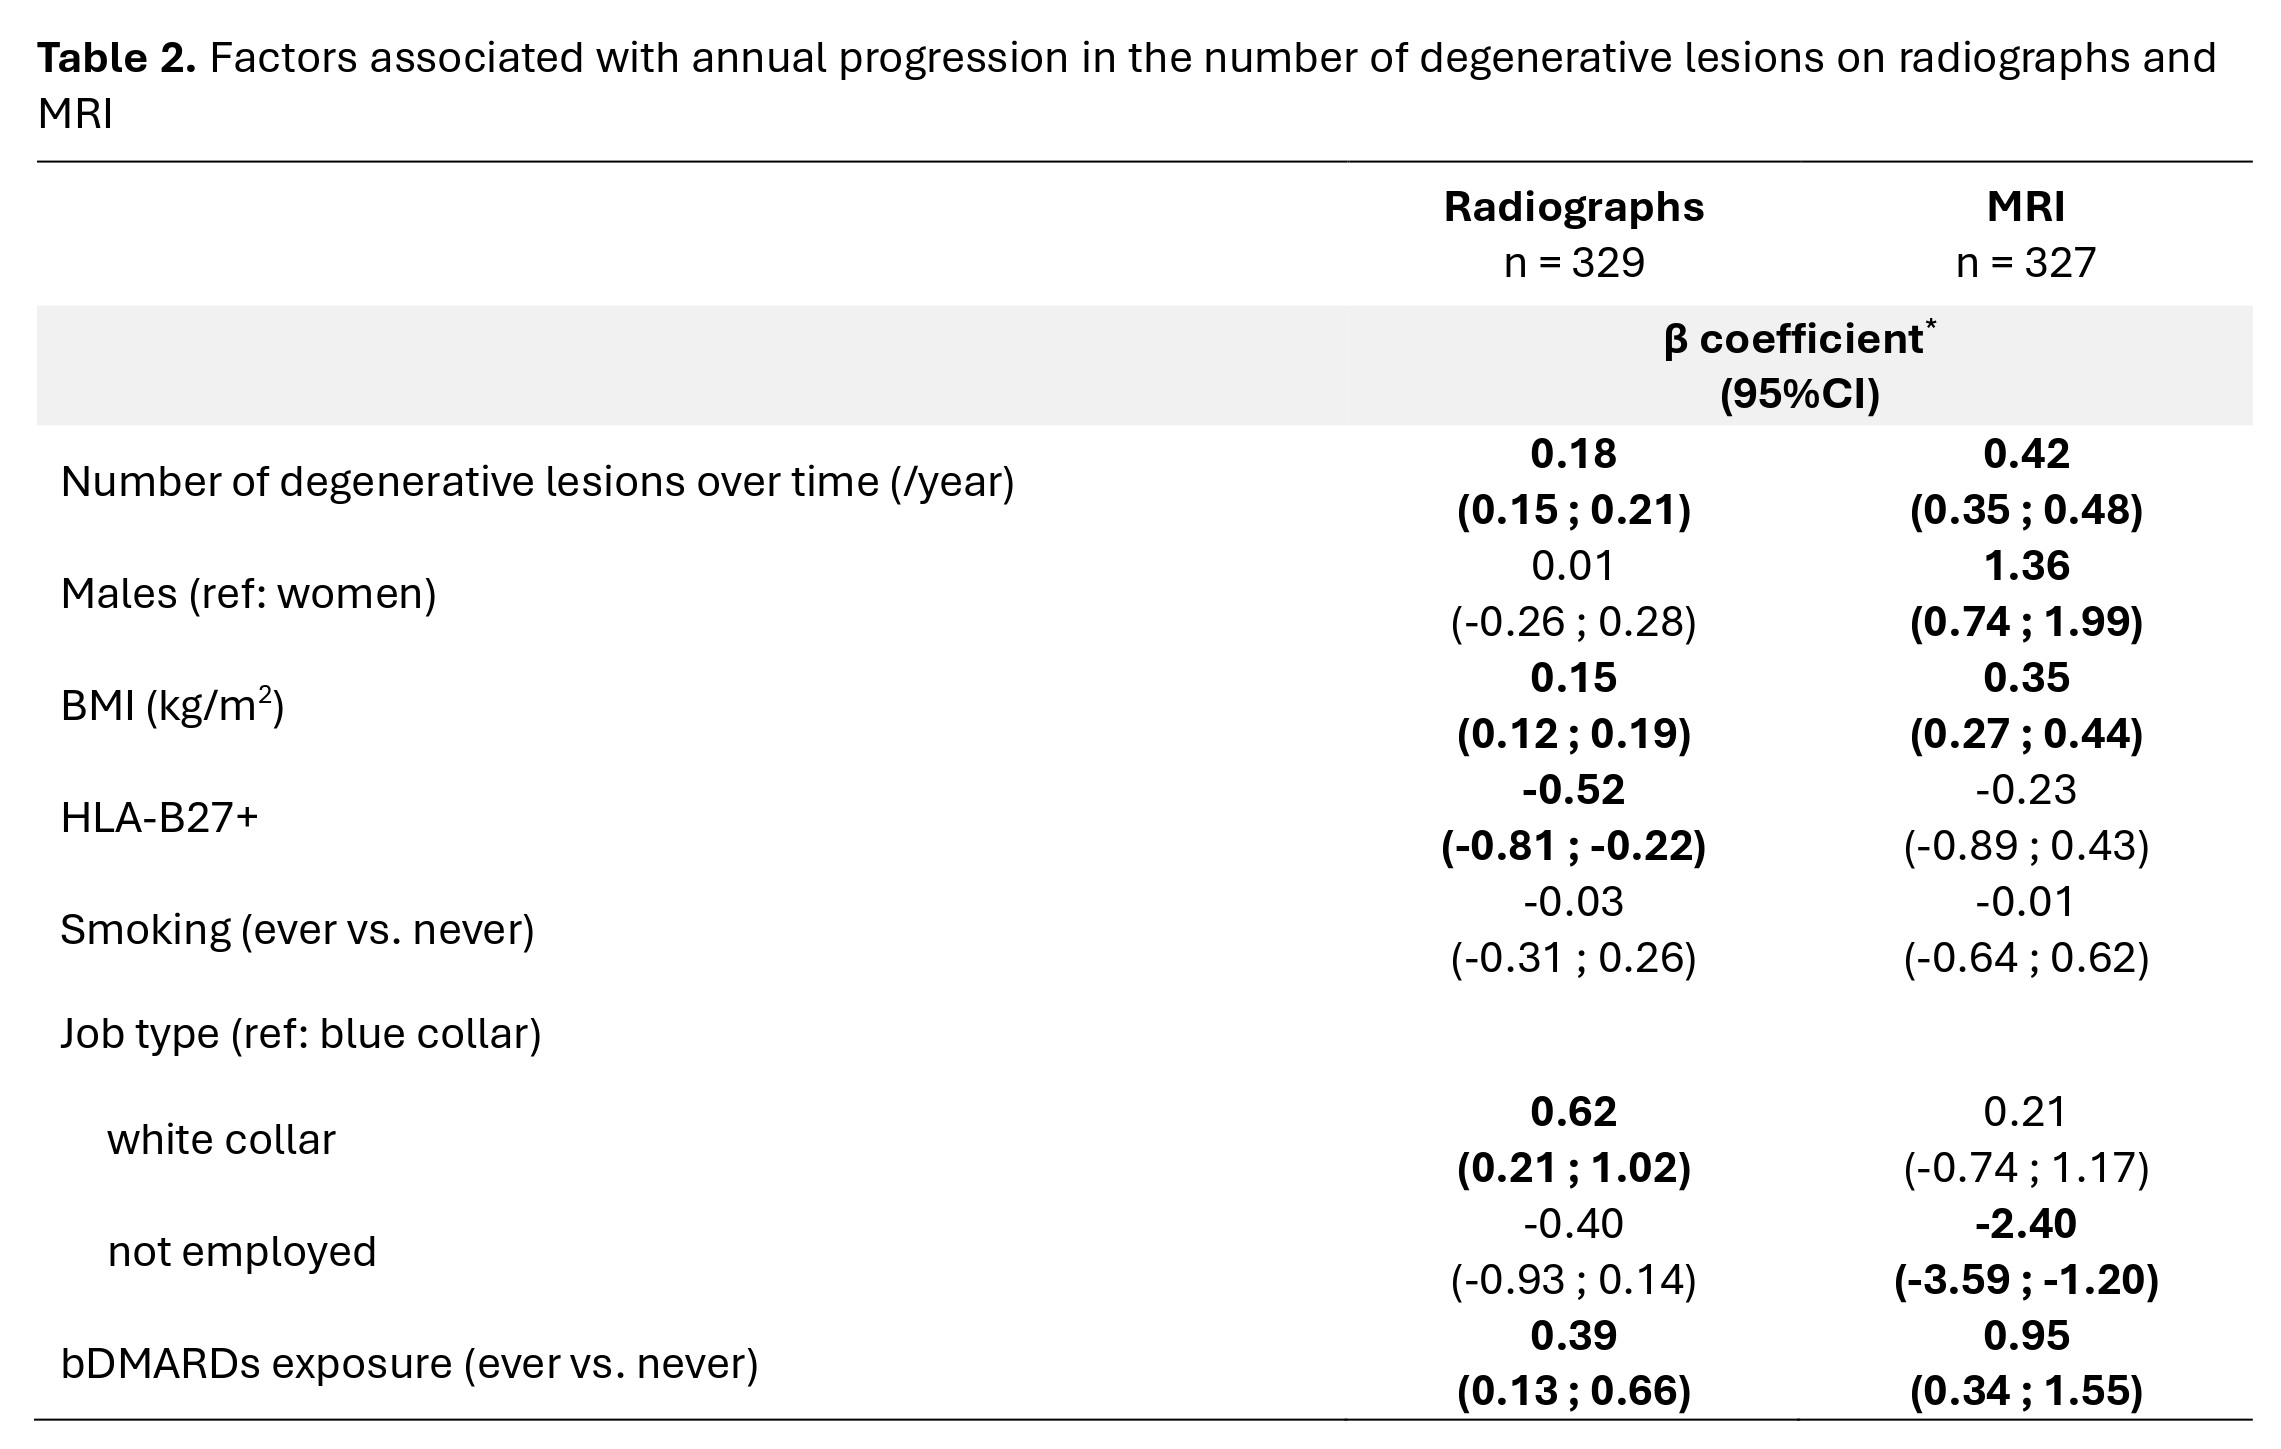
Bold characters indicate significant values. MRI: magnetic resonance imaging; 95%CI: 95% confidence interval; BMI: body mass index; HLA: human leucocyte antigen; bDMARDs: biological disease-modifying antirheumatic drugs.
To cite this abstract in AMA style:
Pina Vegas L, Ramiro S, van Lunteren M, Loeuille D, Newsum E, Morizot C, van Gaalen F, SARAUX A, Claudepierre P, Feydy A, van der Heijde D, Reijnierse M. Factors Associated with the Evolution of Degenerative Spinal Lesions in Axial Spondyloarthritis: 10-Year Follow-up of the DESIR Cohort [abstract]. Arthritis Rheumatol. 2024; 76 (suppl 9). https://acrabstracts.org/abstract/factors-associated-with-the-evolution-of-degenerative-spinal-lesions-in-axial-spondyloarthritis-10-year-follow-up-of-the-desir-cohort/. Accessed .« Back to ACR Convergence 2024
ACR Meeting Abstracts - https://acrabstracts.org/abstract/factors-associated-with-the-evolution-of-degenerative-spinal-lesions-in-axial-spondyloarthritis-10-year-follow-up-of-the-desir-cohort/