Session Information
Session Type: ACR Concurrent Abstract Session
Session Time: 4:30PM-6:00PM
Background/Purpose: Health outcomes after total knee replacement (TKR) are generally worse for patients from high poverty neighborhoods. Whether education mitigates the effect of poverty is not known. We assessed the interaction between education and poverty on pain and function 2 years after TKR.
Methods: Patient-level variables – demographics, baseline and 2-year WOMAC pain and function scores, and geocodable US addresses – were obtained from an institutional TKR registry (5/07 – 2/11). Individual patient data were linked to US Census Bureau data at the census tract level. Statistical models including both patient-level and census tract-level variables were constructed within multilevel frameworks. Linear mixed effects models with separate random intercepts for each census tract were used to assess the effect of the interaction between education at the individual and census tract level and census tract poverty level on WOMAC scores at 2 years.
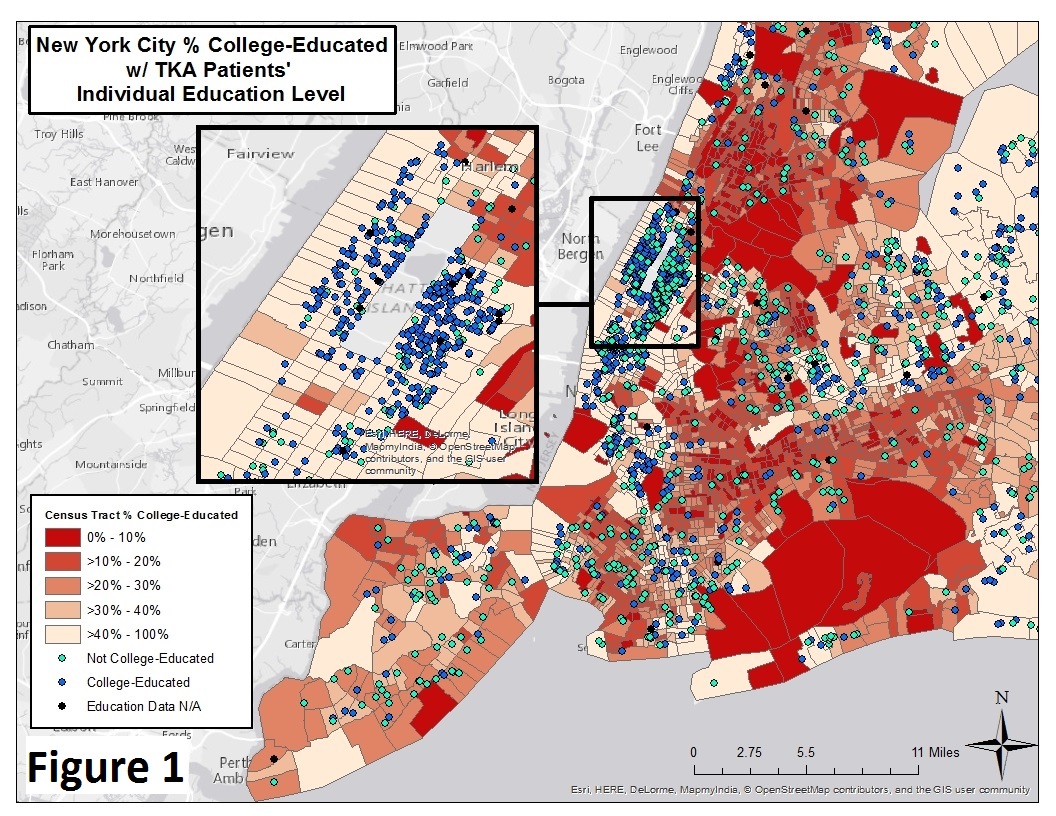
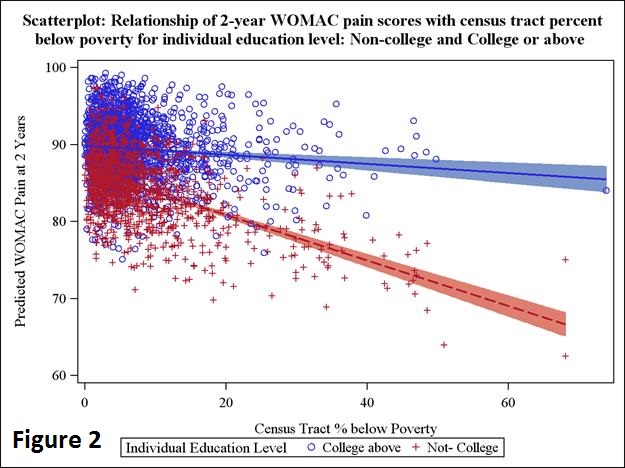
Results: Of 3970 TKR cases, 2438 (61%) were college-educated or above (Table 1, Figure 1). In the univariable analysis, race, sex, BMI, baseline WOMAC, and Medicaid were significantly associated with worse WOMAC scores at 2 years. In a linear mixed effects model, living in neighborhoods where <15% are college-educated and living in neighborhoods where ≥15% are below poverty were significantly associated with worse WOMAC pain (p=0.02) and function (p=0.006) at 2 years. There was little interaction between individual education and census tract education in our models, but when we assessed the interaction between individual education and community poverty, we found a significant interaction between them and WOMAC pain or function at 2 years. Comparing patients without college in high vs low poverty communities, WOMAC pain at 2 years was predicted to be 10 points lower (83.36 versus 72.75) and decreased in a linear fashion as community poverty increased, whereas patients with college had a difference in predicted WOMAC pain scores of only 1 point (87.10 vs. 86.09) (Figure 2); results for WOMAC function were similar.
Conclusion: In poorer communities, those without college education attain WOMAC scores 10 points lower than those with college education, a clinically meaningful difference. Education has no effect in wealthier communities. The reason education appears protective in poorer communities needs further study.
|
Table 1. Characteristics of the cohort |
||||
|
Characteristic |
Total |
College or above |
Non-college |
P-Value |
|
Number of patients |
3970 (100%) |
2438 (61%) |
1532 (39%) |
|
|
Age at surgery (years), mean (SD) |
67.13(9.58) |
66.86 (9.35) |
67.55 (9.92) |
0.014 |
|
Female, n (%) |
2437 (61.39%) |
1397 (57.30%)
|
1040 (67.89%)
|
<0.0001 |
|
BMI (kg/m2), mean (SD) |
29.99 (5.92) |
29.29 (5.53) |
31.10 (6.34) |
<0.0001 |
|
Hispanic, n (%) |
81 (2.30%) |
39 (1.78%)
|
42 (3.15%)
|
0.008 |
|
One or more comorbidities, n (%) |
1120 (28.21%) |
634 (26.00%) |
486 (31.72%) |
<0.0001 |
|
White, n (%) |
3780 (95.21%)
|
2352 (96.47%)
|
1428 (93.21%)
|
<0.0001 |
|
Insurance payer, n (%) Medicaid Medicare Other insurance |
58 (1.46%) 2492 (62.77%) 1420 (35.77%) |
13 (0.53%) 1499 (61.48%) 926 (37.98%) |
45 (2.94%) 993 (64.82%) 494 (32.25%) |
<0.0001 |
|
ASA Class, n (%) Missing I-II III-IV |
2 3162 (79.69%) 806 (20.31%) |
1 1963 (80.55%) 474 (19.45%) |
1 1199 (78.31%) 332 (21.69%) |
0.09 |
|
Hospital for Special Surgery Expectations Score, mean (SD) |
78.50 (17.99) |
79.03 (17.56) |
77.59 (18.68) |
0.087 |
|
WOMAC pain at baseline, mean (SD) |
54.32 (17.65) |
57.23 (16.92) |
49.63 (17.81) |
<0.0001 |
|
WOMAC pain at 2 Years, mean (SD) |
87.42 (16.05) |
89.21 (14.01) |
84.54 (18.52) |
<0.0001 |
|
Delta WOMAC pain, mean (SD) |
33.13 (20.30) |
32.08 (19.36) |
34.85 (21.65) |
<0.0001 |
|
WOMAC function at baseline, mean (SD) |
53.45 (17.76) |
56.95 (17.07) |
47.85 (17.39) |
<0.0001 |
|
WOMAC function at 2 Years, mean (SD) |
85.08 (16.49) |
86.94 (14.52) |
82.09 (18.86) |
<0.0001 |
|
Delta WOMAC function, mean (SD) |
31.58 (19.73) |
30.00 (18.87) |
34.11 (20.80) |
<0.0001 |
|
Census Tract Percent Below Poverty Level, n (%) <10% 10%-20% >20% |
3174 (79.97%) 594 (14.97%) 201 (5.06%)
|
2021 (82.93%) 318 (13.05%) 98 (4.02%)
|
1153 (75.26%) 276 (18.02%) 103 (6.72%)
|
<0.0001 |
|
Census Tract Percent Below Poverty Level, n (%) Low poverty <15% Middle to high poverty >=15% |
3174 (79.97%) 594 (14.97%)
|
2247 (92.20%) 190 (7.80%)
|
1346 (87.86%) 186 (12.14%)
|
<0.0001 |
|
Census Tract Percent of 25 or older with Bachelor’s degree or above, n (%) Low Education <15% Middle Education 15%-39.9% High Education >=40% |
81 (2.04%) 1194 (30.08%) 2695 (67.88%)
|
18 (0.74%) 537 (22.03%) 1883 (77.24%)
|
63 (4.11%) 657 (42.89%) 812 (53.00%)
|
<0.0001 |
To cite this abstract in AMA style:
Goodman SM, Mehta BY, Zhang M, Szymonifka J, Navarro-Millán I, Nguyen JT, Lee YY, Figgie MP, Parks ML, Dey SA, Crego D, Russell LA, Mandl LA, Bass AR. Can Education Mitigate the Effect of Poverty on Total Knee Replacement (TKR) Outcomes? [abstract]. Arthritis Rheumatol. 2017; 69 (suppl 10). https://acrabstracts.org/abstract/can-education-mitigate-the-effect-of-poverty-on-total-knee-replacement-tkr-outcomes/. Accessed .« Back to 2017 ACR/ARHP Annual Meeting
ACR Meeting Abstracts - https://acrabstracts.org/abstract/can-education-mitigate-the-effect-of-poverty-on-total-knee-replacement-tkr-outcomes/


