Session Information
Date: Tuesday, October 28, 2025
Title: (2524–2546) Vasculitis – Non-ANCA-Associated & Related Disorders Poster III
Session Type: Poster Session C
Session Time: 10:30AM-12:30PM
Background/Purpose: IgG4-related disease (IgG4-RD) is a chronic immune-mediated disease characterized by mass-forming lesions and organ dysfunction. The smoldering tempo and often asymptomatic nature of IgG4-RD pose challenges in the monitoring of disease activity. At least fourteen protein biomarkers have been reported, including serum IgG4. However, all reported biomarkers have been studied in relative isolation without direct comparison, and none have been demonstrated to correlate with relapsing disease. The goal of this study was to comprehensively screen inflammation associated proteins to identify novel biomarkers of disease activity in IgG4-RD that correlate with relapsing disease.
Methods: Ninety-two inflammation related proteins were measured across 59 patients with IgG4-RD, 49 healthy donors (HD), and 21 patients with sarcoidosis. Six IgG4-RD patients had pre- and post-prednisone samples available that were also studied. Statistical analyses were adjusted for age, sex, and multiple comparisons. Biomarkers that distinguished IgG4-RD were studied by receiver operating characteristic curves, hierarchical clustering, and linear regression. Flow cytometry was performed in a subset of patients to quantify activated CD4+ T cells, activated B cell subsets, and plasmablasts.
Results: A cassette of 20 inflammation-associated proteins was identified that distinguished IgG4-RD from healthy donors (Figures 1A-B). Among these, CCL19, CCL2, CCL13, and CXCL11 were the most accurate and non-redundant in defining IgG4-RD showing a composite area under the curve of 0.811(Figure 1C). CCL19, CCL2 and CCL13 increased distinguished IgG4-RD from sarcoidosis whereas CXCL11 did not (Figure 1D). These four biomarkers correlated with disease severity based on number of organs involved and clinical laboratory parameters of disease activity, including serum IgG4, IgE, absolute eosinophil count, and complement proteins C3 and C4 (Figure 2). Furthermore, these four biomarkers showed the capacity to predict underlying states of CD4+ T cell and B cell activation based on correlations with flow cytometry data. CCL19, CCL2, and CCL13 showed trends of decline following treatment with prednisone suggesting dynamic changes in response to immunosuppressive therapy and values declining in conjunction with remission. CCL19 and CCL2 were able to distinguish IgG4-RD patients with relapsing disease, single organ involvement, and normal baseline serum IgG4 levels from healthy donors (Figure 3), suggesting promise in the clinical utility of these biomarkers.
Conclusion: CCL19, CCL2, CCL13, and CXCL11 are markedly upregulated in IgG4-RD. CCL19 and CCL2 may be particularly impactful in the longitudinal monitoring of disease activity while CCL19, CCL2, and CCL13 may also distinguish IgG4-RD from the mimicking condition sarcoidosis. Additional studies comparing other IgG4-RD mimickers and paired longitudinal samples are needed.
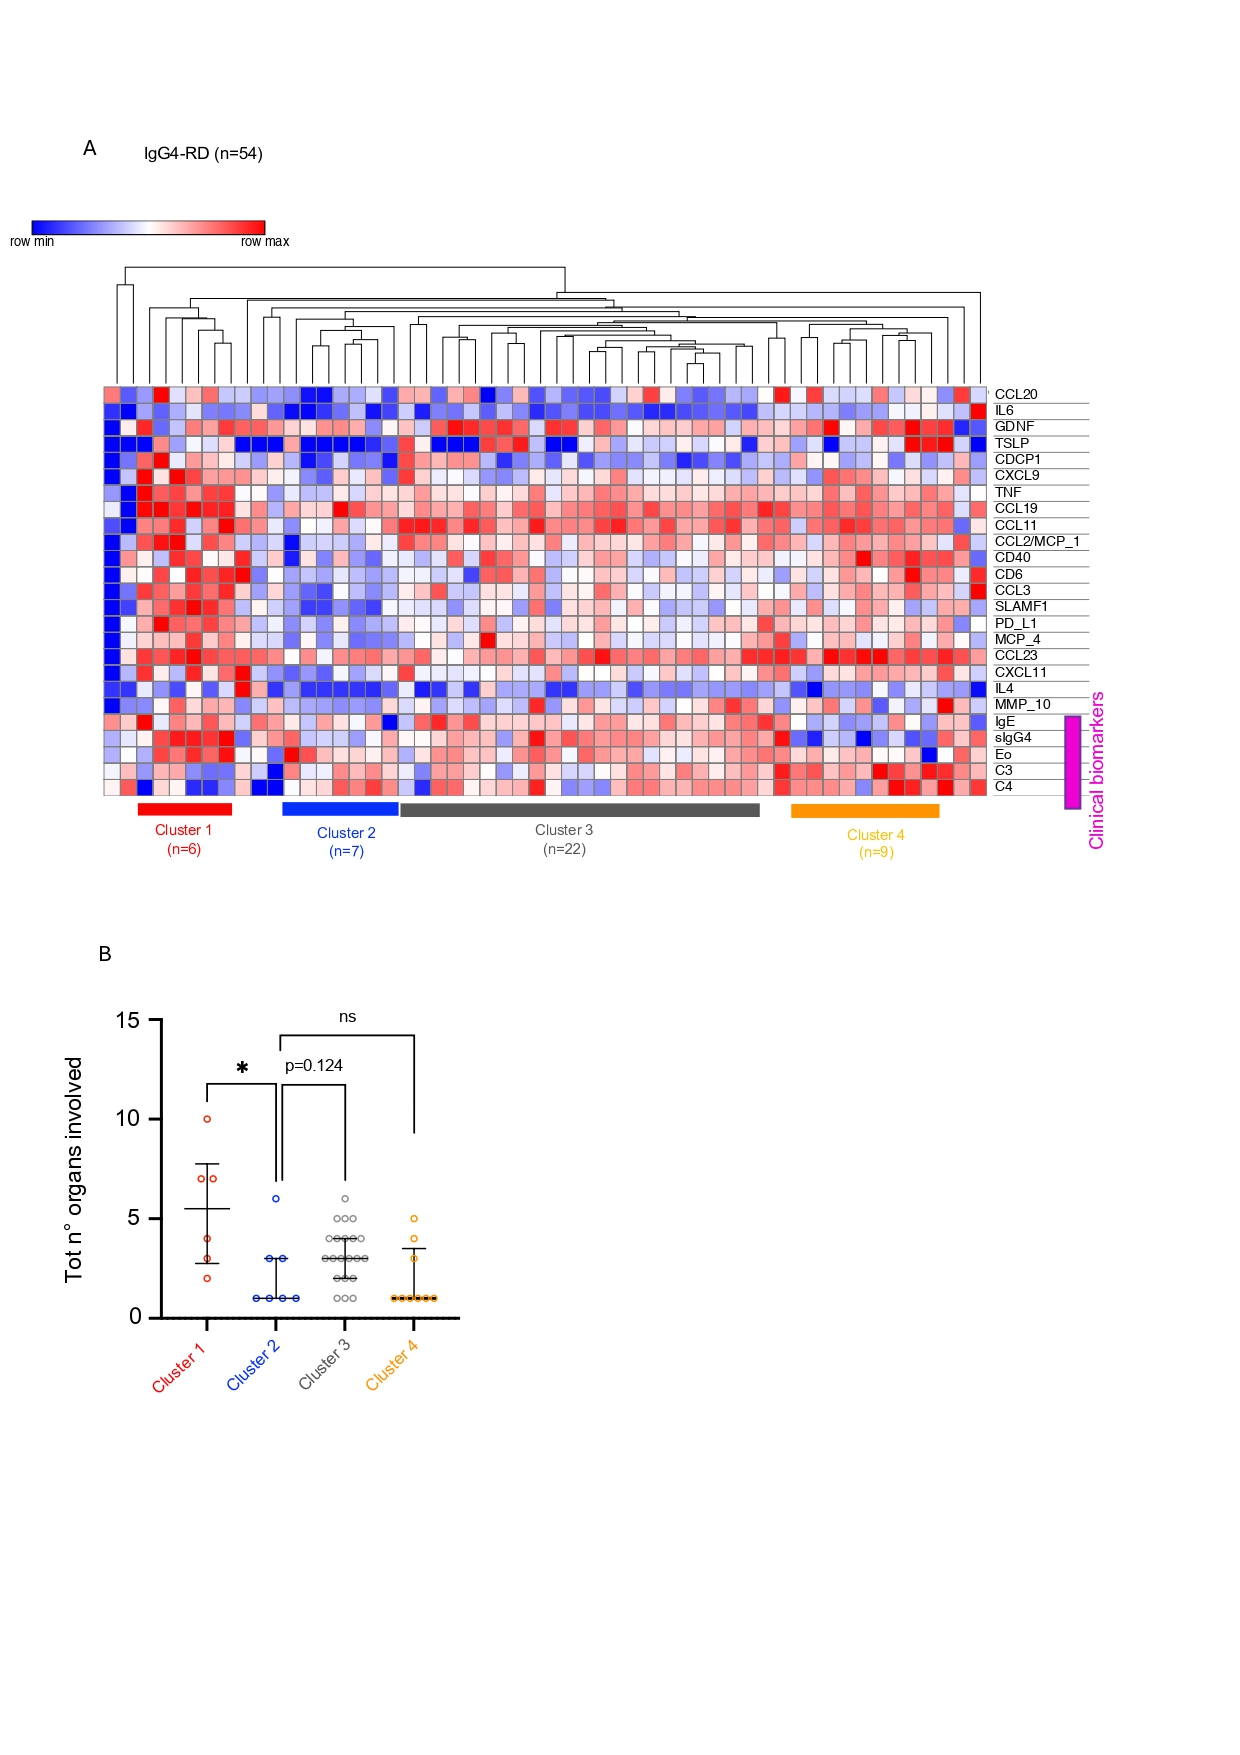 Figure 1. Screening of 92 inflammation associated proteins identifies a cassette of 20 proteins that distinguishes IgG4-RD. (A) Heatmap with hierarchical clustering of differentially abundant plasma proteins between IgG4-RD and healthy donors. (B) Volcano plot displaying log10 false discovery rate (FDR) values on the y-axis and log10 fold change values on the x-axis for all proteins included in the O-link 96 inflammation panel comparing untreated IgG4-RD (Nf59) to age- and sex-matched healthy donors without immune mediated disease (Nf49). Dashed line represents FDR adjusted p-value cut-off of 0.05 for significantly enriched proteins after controlling for multiple comparisons, age, and sex across cohorts. Red dots represent the four selected proteins positively enriched in IgG4-RD with FDR adjusted p-values < 0.05. The 20 dots in the right upper quadrant represent proteins enriched in IgG4-RD patients. (C) Receiver operating characteristic (ROC) curve displays the ability of selected proteins to distinguish IgG4-RD from healthy donors. Areas under the curve are displayed parenthetically after each protein name in the legend. (D) Dot and violin plots displaying individual normalized protein expression (NPX) values for the CCL19, CCL2, CCL13 and CXCL11 in IgG4-RD, HD and sarcoidosis; blue lines represent interquartile range and red line represents median; p value was calculated by ordinary ANOVA. Symbols: ns p value >0.05, *p ≤0.05, ** p≤ 0.01, *** p≤0.001, **** p≤0.0001.
.jpg) Figure 2. Novel biomarkers, including CCL19 and CCL2, correlate with extensive organ involvement and clinical biomarkers of severe disease. (A) Heatmap with hierarchical clustering of 20 IgG4-RD defining plasma proteins plotted with clinical biomarkers of severe disease including serum IgG4, IgE, absolute eosinophil count, C3, and C4 values. Only 54 patients had all clinical biomarkers available at time of blood draw. For hierarchical clustering the metric used was Euclidian distance and the linkage method was the average. (B) Dot plots showing total number of organs involved in each of the four clusters identified by hierarchical clustering, each dot corresponds to a patient belonging to one of the clusters. Bars represent median and interquartile range. P value the was calculated with Mann-Whitney U test. Symbols: ns p value >0.05, *p ≤0.05, ** p≤ 0.01, *** p≤0.001, **** p≤0.0001.
Figure 2. Novel biomarkers, including CCL19 and CCL2, correlate with extensive organ involvement and clinical biomarkers of severe disease. (A) Heatmap with hierarchical clustering of 20 IgG4-RD defining plasma proteins plotted with clinical biomarkers of severe disease including serum IgG4, IgE, absolute eosinophil count, C3, and C4 values. Only 54 patients had all clinical biomarkers available at time of blood draw. For hierarchical clustering the metric used was Euclidian distance and the linkage method was the average. (B) Dot plots showing total number of organs involved in each of the four clusters identified by hierarchical clustering, each dot corresponds to a patient belonging to one of the clusters. Bars represent median and interquartile range. P value the was calculated with Mann-Whitney U test. Symbols: ns p value >0.05, *p ≤0.05, ** p≤ 0.01, *** p≤0.001, **** p≤0.0001.
.jpg) Figure 3. CCL19, CCL2, CCL13, CXCL11 may provide utility in difficult to monitor cases. (A) Dot and violin plots displaying individual normalized protein expression (NPX) values for the CCL19, CCL2, CCL13, and CXCL11 comparing treatment naïve and relapsing cohorts with healthy donors (HD). (B) Dot and violin plots displaying individual NPX values for the CCL19, CCL2, CCL13, and CXCL11 comparing IgG4-RD patients with single organ involvement (n=14) vs. HD. (C) Dot and violin plots displaying individual NPX values for the CCL19, CCL2, CCL13, and CXCL11 comparing IgG4-RD patients with normal serum IgG4 values (4-86mg/dl) (n=10) vs. healthy donors (HD). Blue lines represent interquartile range and red line represents median; p values computed by Mann-Whitney U test. Symbols: * p ≤0.05, ** p≤ 0.01, *** p≤0.001, **** p≤0.0001.
Figure 3. CCL19, CCL2, CCL13, CXCL11 may provide utility in difficult to monitor cases. (A) Dot and violin plots displaying individual normalized protein expression (NPX) values for the CCL19, CCL2, CCL13, and CXCL11 comparing treatment naïve and relapsing cohorts with healthy donors (HD). (B) Dot and violin plots displaying individual NPX values for the CCL19, CCL2, CCL13, and CXCL11 comparing IgG4-RD patients with single organ involvement (n=14) vs. HD. (C) Dot and violin plots displaying individual NPX values for the CCL19, CCL2, CCL13, and CXCL11 comparing IgG4-RD patients with normal serum IgG4 values (4-86mg/dl) (n=10) vs. healthy donors (HD). Blue lines represent interquartile range and red line represents median; p values computed by Mann-Whitney U test. Symbols: * p ≤0.05, ** p≤ 0.01, *** p≤0.001, **** p≤0.0001.
To cite this abstract in AMA style:
Bonaso F, Jiang B, Yockey L, Akaa J, Doyle I, Hsu E, Leson C, McMahon G, Jha I, Montesi S, Katz G, Pillai S, Lee P, Stone J, Wallace Z, Perugino C. Broad Screening of Inflammation-Associated Proteins Identifies Serum CCL19 and CCL2 as Versatile Biomarkers of Disease Activity in IgG4-Related Disease [abstract]. Arthritis Rheumatol. 2025; 77 (suppl 9). https://acrabstracts.org/abstract/broad-screening-of-inflammation-associated-proteins-identifies-serum-ccl19-and-ccl2-as-versatile-biomarkers-of-disease-activity-in-igg4-related-disease/. Accessed .« Back to ACR Convergence 2025
ACR Meeting Abstracts - https://acrabstracts.org/abstract/broad-screening-of-inflammation-associated-proteins-identifies-serum-ccl19-and-ccl2-as-versatile-biomarkers-of-disease-activity-in-igg4-related-disease/