Session Information
Session Type: Poster Session A
Session Time: 9:00AM-11:00AM
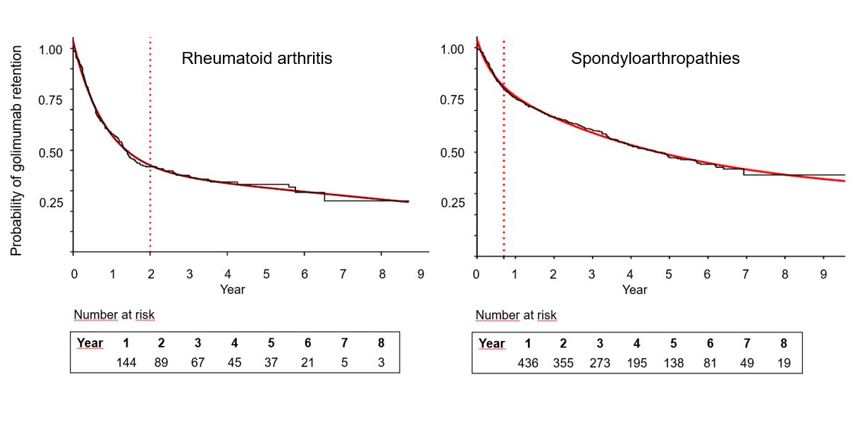
Background/Purpose: Selecting patients with the highest probability of long-term retention of biological treatments is important from a clinical and cost-effectiveness point of view. In this work, we analyzed the Kaplan-Meier curve of golimumab retention in patients with rheumatoid arthritis (RA) and spondyloarthropathies (SpA, including axial SpA plus psoriatic arthritis [PsA]) fitted to a two-phase exponential decay curve, to identify the moment the curve changes from fast to slow decay, and to study factors related to golimumab retention at that moment, i.e, the patient profiles most likely to retain golimumab in the long term.
Methods: Data were retrospectively analyzed from the BIOBADASER registry. The Kaplan–Meier retention curve of golimumab was fitted to a two-phase exponential decay curve using GraphPad Prism version 9.3.1 for Windows, and the change in the trend of the curve from fast to slow decay (i.e, from high to low golimumab discontinuation rate) was identified with the formula:
Retention0 – SpanFast = Retention0 (Retention0 − Plateau) * PercentFast * 0.01
(Retention0 = retention value when time is zero, Plateau = retention value at infinite times, PercentFast = fraction of the span (from Retention0 to Plateau) where the decay is fastest).
Variables associated with retention at the moment of the decay change were studied with Cox-regression analysis. Furthermore, the retention rates at that moment by subgroups of combination of the different variables identified in the Cox regression were calculated. Axial SpA and PsA showed similar curves and were analyzed together as a group (SpA group).
Results: A total of 267 patients with RA and 618 with SpA were included. The Kaplan-Meier curve fitted to a two-phase exponential decay curve for RA and for SpA yielded a coefficient of determination (R2) = 0.99 and identified month 24 and month 8 as the moment the curve changed from fast to slow decay for RA and for SpA respectively (figure). By Cox regression analysis, second/third line of therapy, older age and use of glucocorticoids at golimumab initiation were associated with golimumab discontinuation at month 24 in RA. In SpA, factors associated with golimumab discontinuation at month 8 were female sex, second/third line of therapy and disease activity > median at golimumab initiation. Tables 1 and 2 show the retention rates at month 24 (RA) and at month 8 (SpA) stratified by the variables identified in the Cox regression.
Conclusion: The golimumab retention curve changes from fast to slow decay at month 24 in RA and at month 8 in SpA. After that moment, the rate of golimumab discontinuation slows. The probability of retention of the different patient profiles calculated might allow a better identification of patients with higher probability of retention in the long-term to be treated with golimumab. The study is limited by the low number of patients in several subgroups of RA.
To cite this abstract in AMA style:
Diaz-Gonzalez J, Cea-Calvo L, González-Dávila E, Sánchez-Jareño M, Pombo Suarez M, Alonso F, Castrejon I. Analysis of the Probability of Retention of Golimumab as a Two-phase Exponential Decay Curve in Rheumatoid Arthritis or Spondyloarthropathies to Identify Patients with Higher Probability of Long-term Retention [abstract]. Arthritis Rheumatol. 2023; 75 (suppl 9). https://acrabstracts.org/abstract/analysis-of-the-probability-of-retention-of-golimumab-as-a-two-phase-exponential-decay-curve-in-rheumatoid-arthritis-or-spondyloarthropathies-to-identify-patients-with-higher-probability-of-long-term/. Accessed .« Back to ACR Convergence 2023
ACR Meeting Abstracts - https://acrabstracts.org/abstract/analysis-of-the-probability-of-retention-of-golimumab-as-a-two-phase-exponential-decay-curve-in-rheumatoid-arthritis-or-spondyloarthropathies-to-identify-patients-with-higher-probability-of-long-term/


