Session Information
Session Type: Poster Session B
Session Time: 10:30AM-12:30PM
Background/Purpose: Patient-reported symptoms are crucial for medical anamnesis. Digital symptom checkers often use fixed questions, thereby potentially overlooking relevant symptoms. However, the reliability of self-reported symptoms is uncertain as patients may describe symptoms differently than experts, which could affect diagnostic accuracy. We studied whether self – reported symptoms can predict immune mediated rheumatic diseases (imRD), osteoarthritis and fibromyalgia and if the prediction differed for already diagnosed versus still undiagnosed patients.
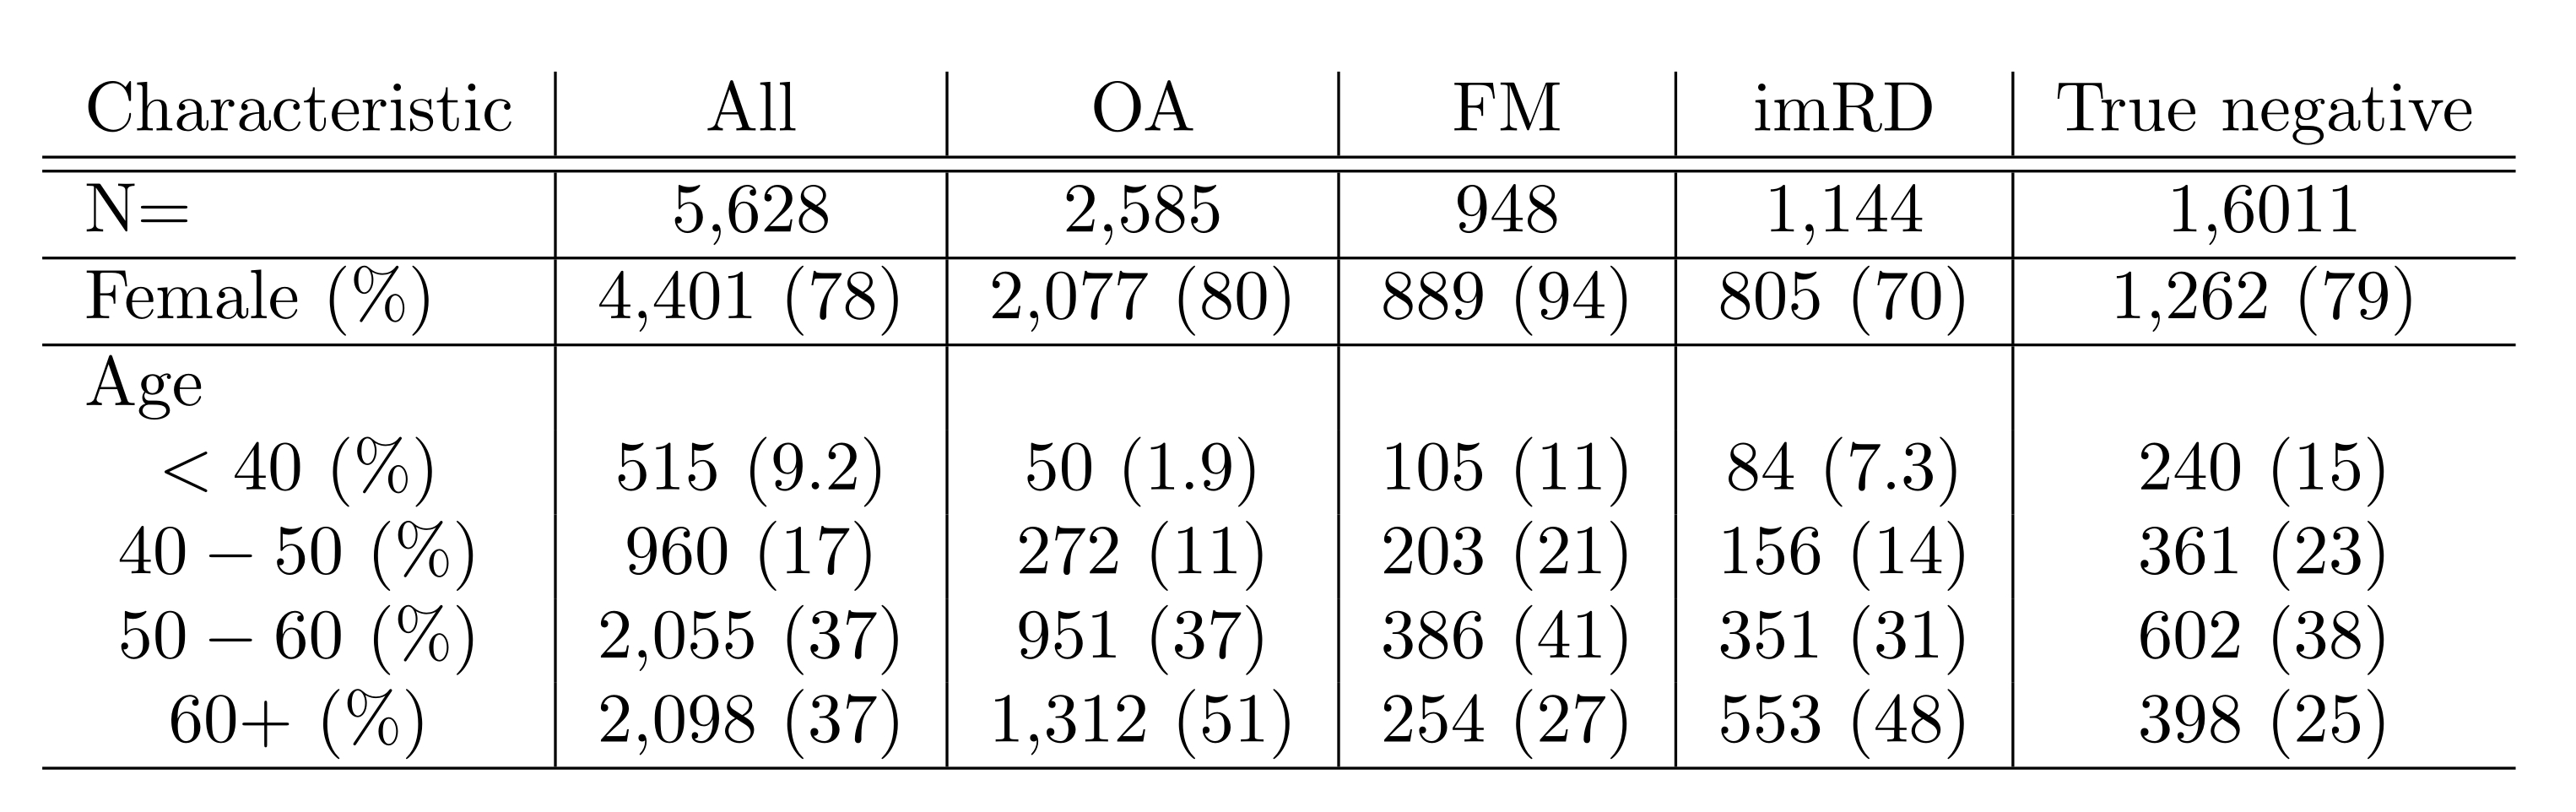
Methods: We analyzed free-text data from 5,628 respondents of the Rheumatic online symptom checker (June 2021 – Feb 2023). Respondents could complete it with multiple diagnoses. We employed natural language processing and tested 8 machine learning (ML) models with term frequency – inverse document frequency on 80% of the data using 2×5 – fold cross validation. We further optimized the model with the best receiver operating characteristic – area under curve (ROC-AUC) by hyperparameter tuning and tested it on the 20% left out data. We examined both new and existing cases. Using swarm plots, we identified optimal probability cut-offs for each disease group, prioritizing high positive predictive value (PPV) and specificity for FM and OA, and high sensitivity and negative predictive value (NPV) for imRD.
Results: Of the 8 ML models, the Support Vector Machine performed best with AUCs of 0.66 ± 0.01 for OA, 0.75 ± 0.01 for FM and 0.67 ± 0.01 for imRD. It had high AUC for existing diagnoses (OA: 0.67, FM: 0.74, imRD: 0.7), but poorer performance in predicting new diagnoses (OA: 0.57, FM: 0.65, imRD: 0.65). For overall diagnoses, in OA (Fig 2a & 2b), the 0.50 cut – off corresponded with 76% true positives and 23% false negatives; with the 0.75 cut – off, the true positives decreased to 37% and the false negatives increased to 62%. For FM (Fig 2c & 2d), a cut – off 0.50 resulted in 57% true positives and 43% false negatives; with 0.75 cut – off, the true positives decreased to 32% and the false negatives also increased to 68%. In OA and FM, 0.75 is more specific but less sensitive. For both, we prioritized high PPV and specificity to minimise false positives and to avoid referring patients with these conditions to rheumatologist. For imRD (Fig 2e & 2f), a cut-off of 0.75 optimised specificity and PPV, identifying 16.6% of patients for direct referral to rheumatologist, but also obtained 4.7% false positives and 83.4% false negatives. Another cut-off 0.15 prioritized NPV and sensitivity, identifying 91.3% of true cases, but yielding 80.3% false positives and 8.73% false negatives.
Conclusion: Self-reported symptoms vary between patients with OA, FM, imRD and those who do not have these diseases. Our ML algorithms show a moderate discriminatory ability of free-written text. The descriptions overlap too much to use the text for automatic diagnoses at present. For patients who already were diagnosed, the symptom description could be more accurately used for diagnoses identification. This difference highlights that the accuracy of automated diagnoses depends on patients’ ability to accurately describe symptoms. Free text holds potential for improving diagnostic stratification and referrals for imRD.
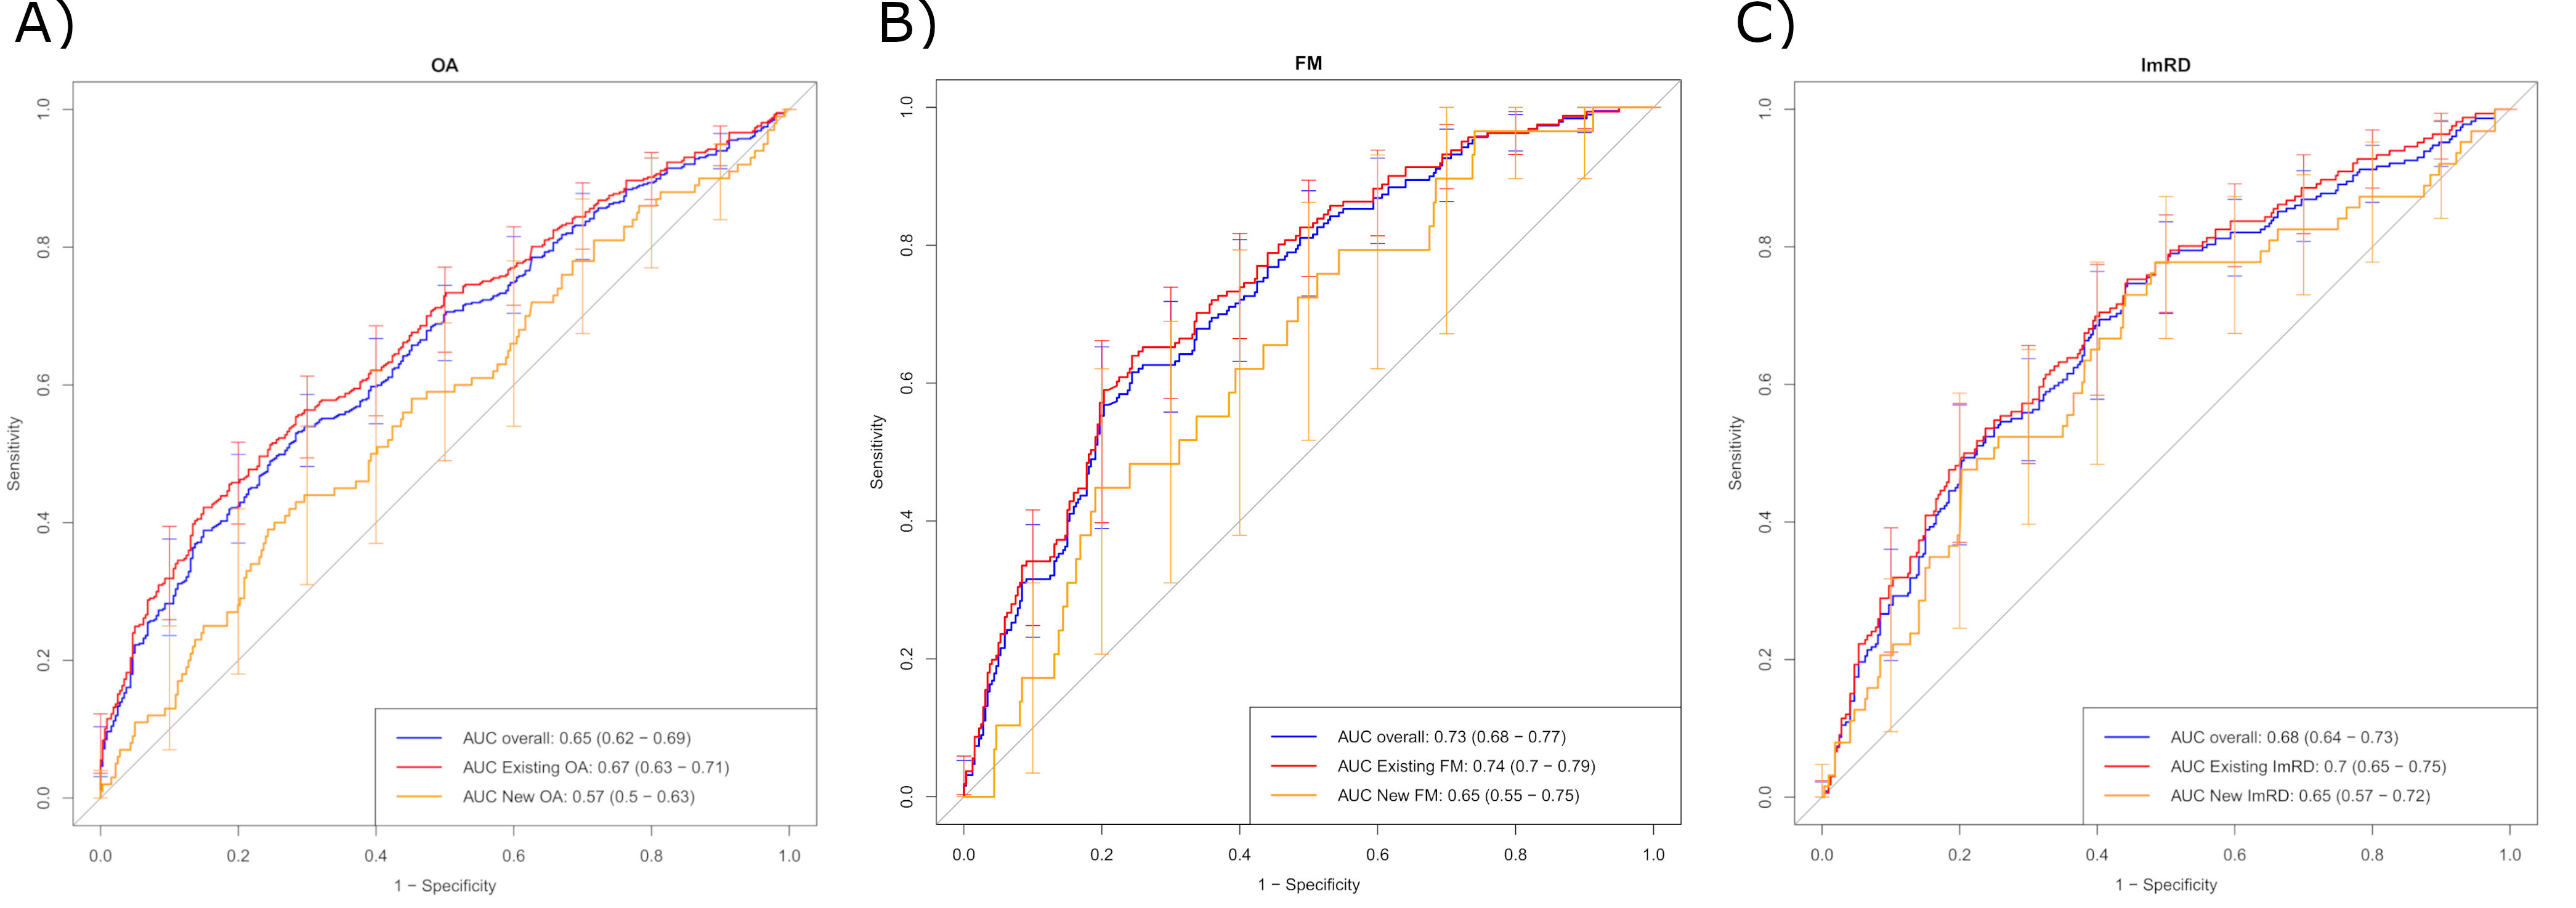
New cases: patients with no diagnosis reported at baseline and with diagnoses reported at follow-up. Existing cases: patients with diagnoses at baseline.
Overall: aggregation of new cases and existing cases.
A) Depicts the different values of AUC in the different scenarios for OA.
B) Depicts the different values of AUC in the different scenarios for FM.
C) Depicts the different values of AUC in the different scenarios for ImRD.
OA: osteoarthritis. FM: fibromyalgia. ImRD: immune – mediated rheumatic diseases. AUC: Area Under the Curve.
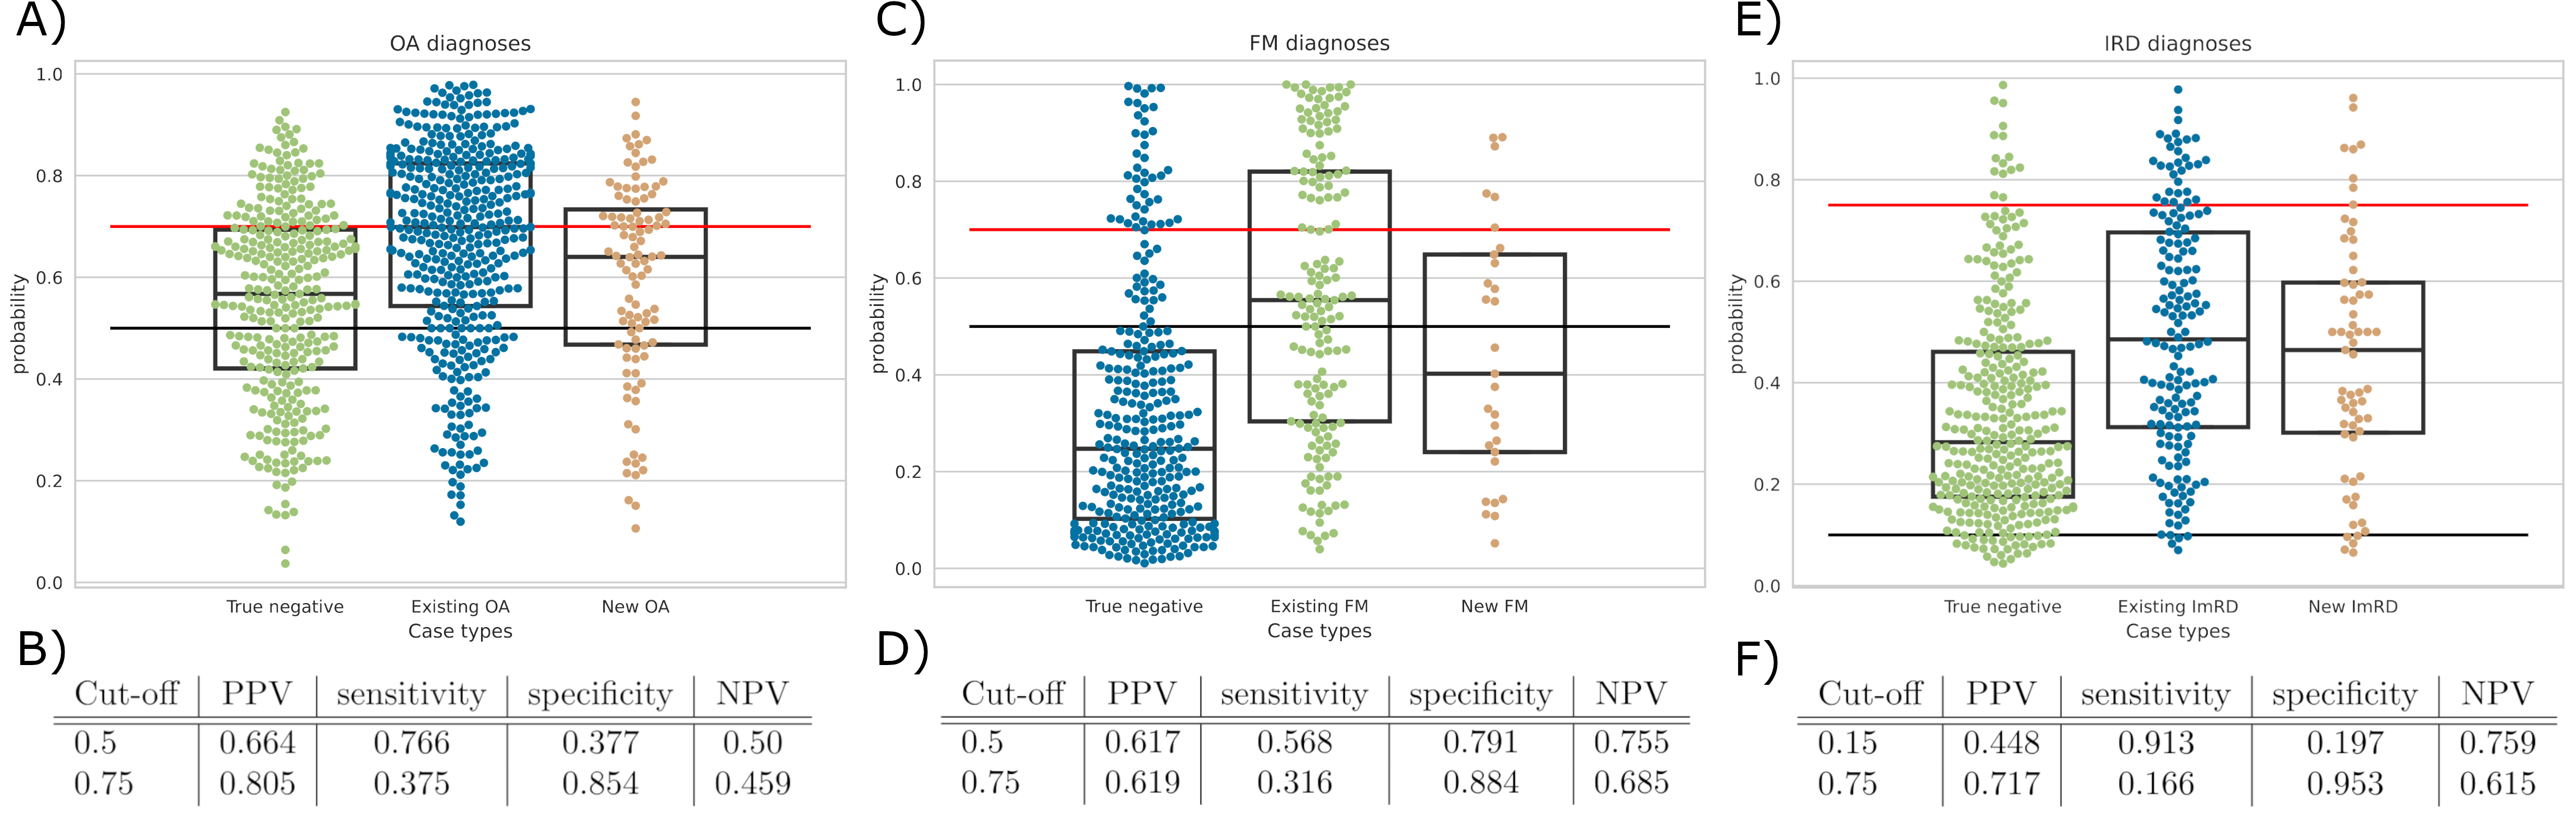
Negative cases are represented by true negative: patients who did not report any diagnosis of the 3 groups of diseases.
Positive cases are divided into new cases and existing cases.
A) Swam plot of OA. Red line represents a possible cut – off of a high confidence of being an OA case while black line represents a moderate confidence of being an OA case.
B) Values of OA cut – offs. The probability cut – offs for optimized PPV and specificity were 0.50 and 0.75.
C) Swarm plot of FM. Red line represents a possible cut – off of a high confidence of being an FM case while black line represents a moderate confidence of being an FM case.
D) Values of FM cut – offs. The probability cut – offs for optimized PPV and specificity were 0.50 and 0.75.
E) Swarm plot of ImRD. Red line represents the patients who should go directly to the rheumatologists and 0.10 would mark the patients who may need some additional testing.
F) Values of ImRD cut – offs. The probability cut – offs for optimized NPV and sensitivity was 0.15. For an optimized PPV and specificity, which would represent a high probability of a positive case of ImRD, the cut-off was 0.75.
OA: osteoarthritis. FM: fibromyalgia. ImRD: immune – mediated rheumatic diseases. PPV: positive predictive value; NPV: negative predictive value.
Negative cases = patients who did not report any diagnosis of the 3 groups of diseases
To cite this abstract in AMA style:
Pérez - Sancristóbal I, Steinz N, Qin L, Maarseveen T, Zegers F, Knevel R. Analysis of Rheumatic Patients’ Self – Reported Symptoms in Free Written Text Using Natural Language Processing [abstract]. Arthritis Rheumatol. 2024; 76 (suppl 9). https://acrabstracts.org/abstract/analysis-of-rheumatic-patients-self-reported-symptoms-in-free-written-text-using-natural-language-processing/. Accessed .« Back to ACR Convergence 2024
ACR Meeting Abstracts - https://acrabstracts.org/abstract/analysis-of-rheumatic-patients-self-reported-symptoms-in-free-written-text-using-natural-language-processing/