Session Information
Session Type: ACR Poster Session B
Session Time: 9:00AM-11:00AM
Background/Purpose: Collagen induced arthritis (CIA) mouse model is used for screening of new drugs for autoimmune arthritis. The conventional read outs of this model are clinical and histological scores. These read-outs have many limitations including (i) longitudinal studies in the same mouse cannot be performed (ii) clinical and histological scores are subjected to observer bias (iii) in vivo cellular events cannot be captured in its native environment. To meet these unmet needs here we have evaluated the utility of 18F-FDG PET imaging in the CIA model.
Methods: Briefly, arthritis was induced using bovine type II collagen in 8-week old male DBA/1J mice (n=30), out of which 20 mice developed arthritis. The disease was allowed to progress till day 45 (pre-treatment time point- Fig 1), 5 mice were sacrificed for histological studies; 10 mice were treated with i.p anti-mouse TNF-α antibody (CNTO5048, Janssen Biotech, USA) every alternate day (300 ug/dose) for next 10 days, and 5 mice received sterile PBS (vehicle control). Mice were scored clinically and had 18F-FDG PET scan on day 0, 28, 45 and 56. The maximum 18F-FDG uptake (standardized uptake value normalized by body weight) was determined for each major joints to generate a comprehensive PET score (PS).
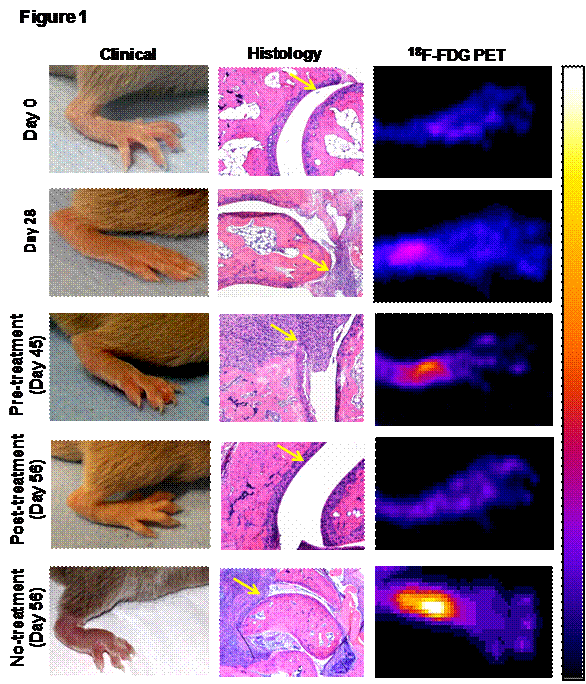
Results: All data represented as median with range. The median clinical score (CS) of the most affected limb in the vehicle treated and untreated gradually increased to 2 (range:1-2) at day 28 (p<0.01), 2 (range:2-3) at day 45 (p<0.01) and 3 (range:2-3) at day 56 (p<0.01) compared to day 0. The clinical observation was confirmed by histological scores (HS). Compared to day 0 (HS=0), the median HS on day 28 was 2 (range:1-3), day 45 was 4 (range:2-4) and day 56 was 4 (range:4-5). The PS on day 0 was 1.02 (range:0.85-1.05). PS increased to median values of 1.52 (range:1.14-2.01) on day 28 (p<0.05), 3.51 (range:1.23-4.76) on day 45 (p<0.05) and 1.76 (range:1.45-2.78) on day 56 (p<0.05). CNTO5048 treatment significantly reduced the median CS to 1 (range:0-2, p<0.01) and HS to 1 (range:1-2, p<0.01) compared to their respective pre-treatment levels (CS:2, HS:4). Similar to CS and HS, PS on day 56 was significantly low (median=0.97, range=0.62-2.12, p<0.01) compared to pre-treatment level (day 45) (median=3.51, range=1.23-4.76) (Fig 1).
Conclusion: Here we have validated in the CIA mouse model that 18F-FDG PET is an in vivo preclinical drug screening tool for antiinflammatory therapies. The use of this imaging modality will allow longitudinal quantitative evaluation response in the same mouse.
Figure 1: 18F-FDG PET imaging, a quantative in vivo pre-clinical drug screening tool. 18F-FDG PET imaging effectively corelated with the both clinical and histopayhological (yellow arrows) therapuetic response of the anti-TNF-α (CNTO5048) antibody. The pseudo-color in PET indicates higher cellular metabolic activity, which resiprocates with the degree of inflammation.
To cite this abstract in AMA style:
Raychaudhuri SP, Raychaudhuri SK, Mitra A, Chaudhari A. 18 F-FDG PET Imaging: An In Vivo quantitative Drug Screening Tool for Novel Antiinflammatory Therapies [abstract]. Arthritis Rheumatol. 2016; 68 (suppl 10). https://acrabstracts.org/abstract/18-f-fdg-pet-imaging-an-in-vivo-quantitative-drug-screening-tool-for-novel-antiinflammatory-therapies/. Accessed .« Back to 2016 ACR/ARHP Annual Meeting
ACR Meeting Abstracts - https://acrabstracts.org/abstract/18-f-fdg-pet-imaging-an-in-vivo-quantitative-drug-screening-tool-for-novel-antiinflammatory-therapies/

