Session Information
Session Type: Abstract Session
Session Time: 10:15AM-10:30AM
Background/Purpose: To elucidate the molecular and cellular mechanisms underlying antiphospholipid antibody (aPL) nephropathy using integrated single-cell and spatial transcriptomic (SP) profiling of kidney tissues.
Methods: Renal biopsy specimens from five patients diagnosed with chronic aPL nephropathy were analyzed. Single-cell RNA sequencing (scRNA-seq) was performed on three samples using the Singleron platform. SP was conducted on two samples using the 10x Genomics Visium platform. Control kidney datasets from three healthy donors were curated from GEO datasets generated using the same platform (GSE171458 and GSE171314). Data processing included dimensionality reduction, unsupervised clustering, differential expressed genes (DEGs) analysis, pathway enrichment, correlation analysis, subclustering analysis.
Results: We profiled 34,253 kidney cells from aPL nephropathy patients (n=3) and healthy controls (n=3). Integration of single-cell clustering data with SP profiles revealed three cell populations within the pathognomonic vascular lesion regions: endothelial cells (ECs), stromal cells (Stroma) and mononuclear phagocytes (MNPs). To molecularly characterize these populations,DEGs analysis was conducted, identifying upregulation of mesenchymal cell markers, CCN2, SOX18, JUN and JUNB, in ECs. ECs from aPL nephropathy samples exhibited marked inflammatory pathway activation, suggesting an inflammatory vascular microenvironment. In parallel, ECs and Stroma showed enrichment of fibrotic and proliferative pathways along with upregulation of complement and coagulation cascades, and ECM score, indicating the potential activation of endothelial-to- mesenchymal transition (EndoMT) in ECs. Further complement gene analysis identified MNPs as the primary renal complement source (Figure 1).Subclustering of ECs and Stroma identified 12 distinct subtypes. Pathway scoring indicated dominant complement activation and significantly elevated ECM scores in afferent/ efferent arteriole (AEA), SOX9⁺ ECs and peritubular capillary type 2 (PTC2). Complement-ECM correlation (r=0.49, p < 0.001) and CCN2-complement linkage in AEA (r=0.5, p < 0.01) highlighted complement-driven ECM pathology. Spatial validation confirmed lesion-associated ECs as AEA subtypes (Figure 2).
Conclusion: This study presents an integrated single-cell and SP atlas of aPL nephropathy and uncovers a pathogenic cascade involving endothelial inflammation, MNP-derived complement activation, and ECM organization. Our findings support a model of complement associated EndoMT, offering mechanistic insights and potential therapeutic targets for aPL nephropathy.
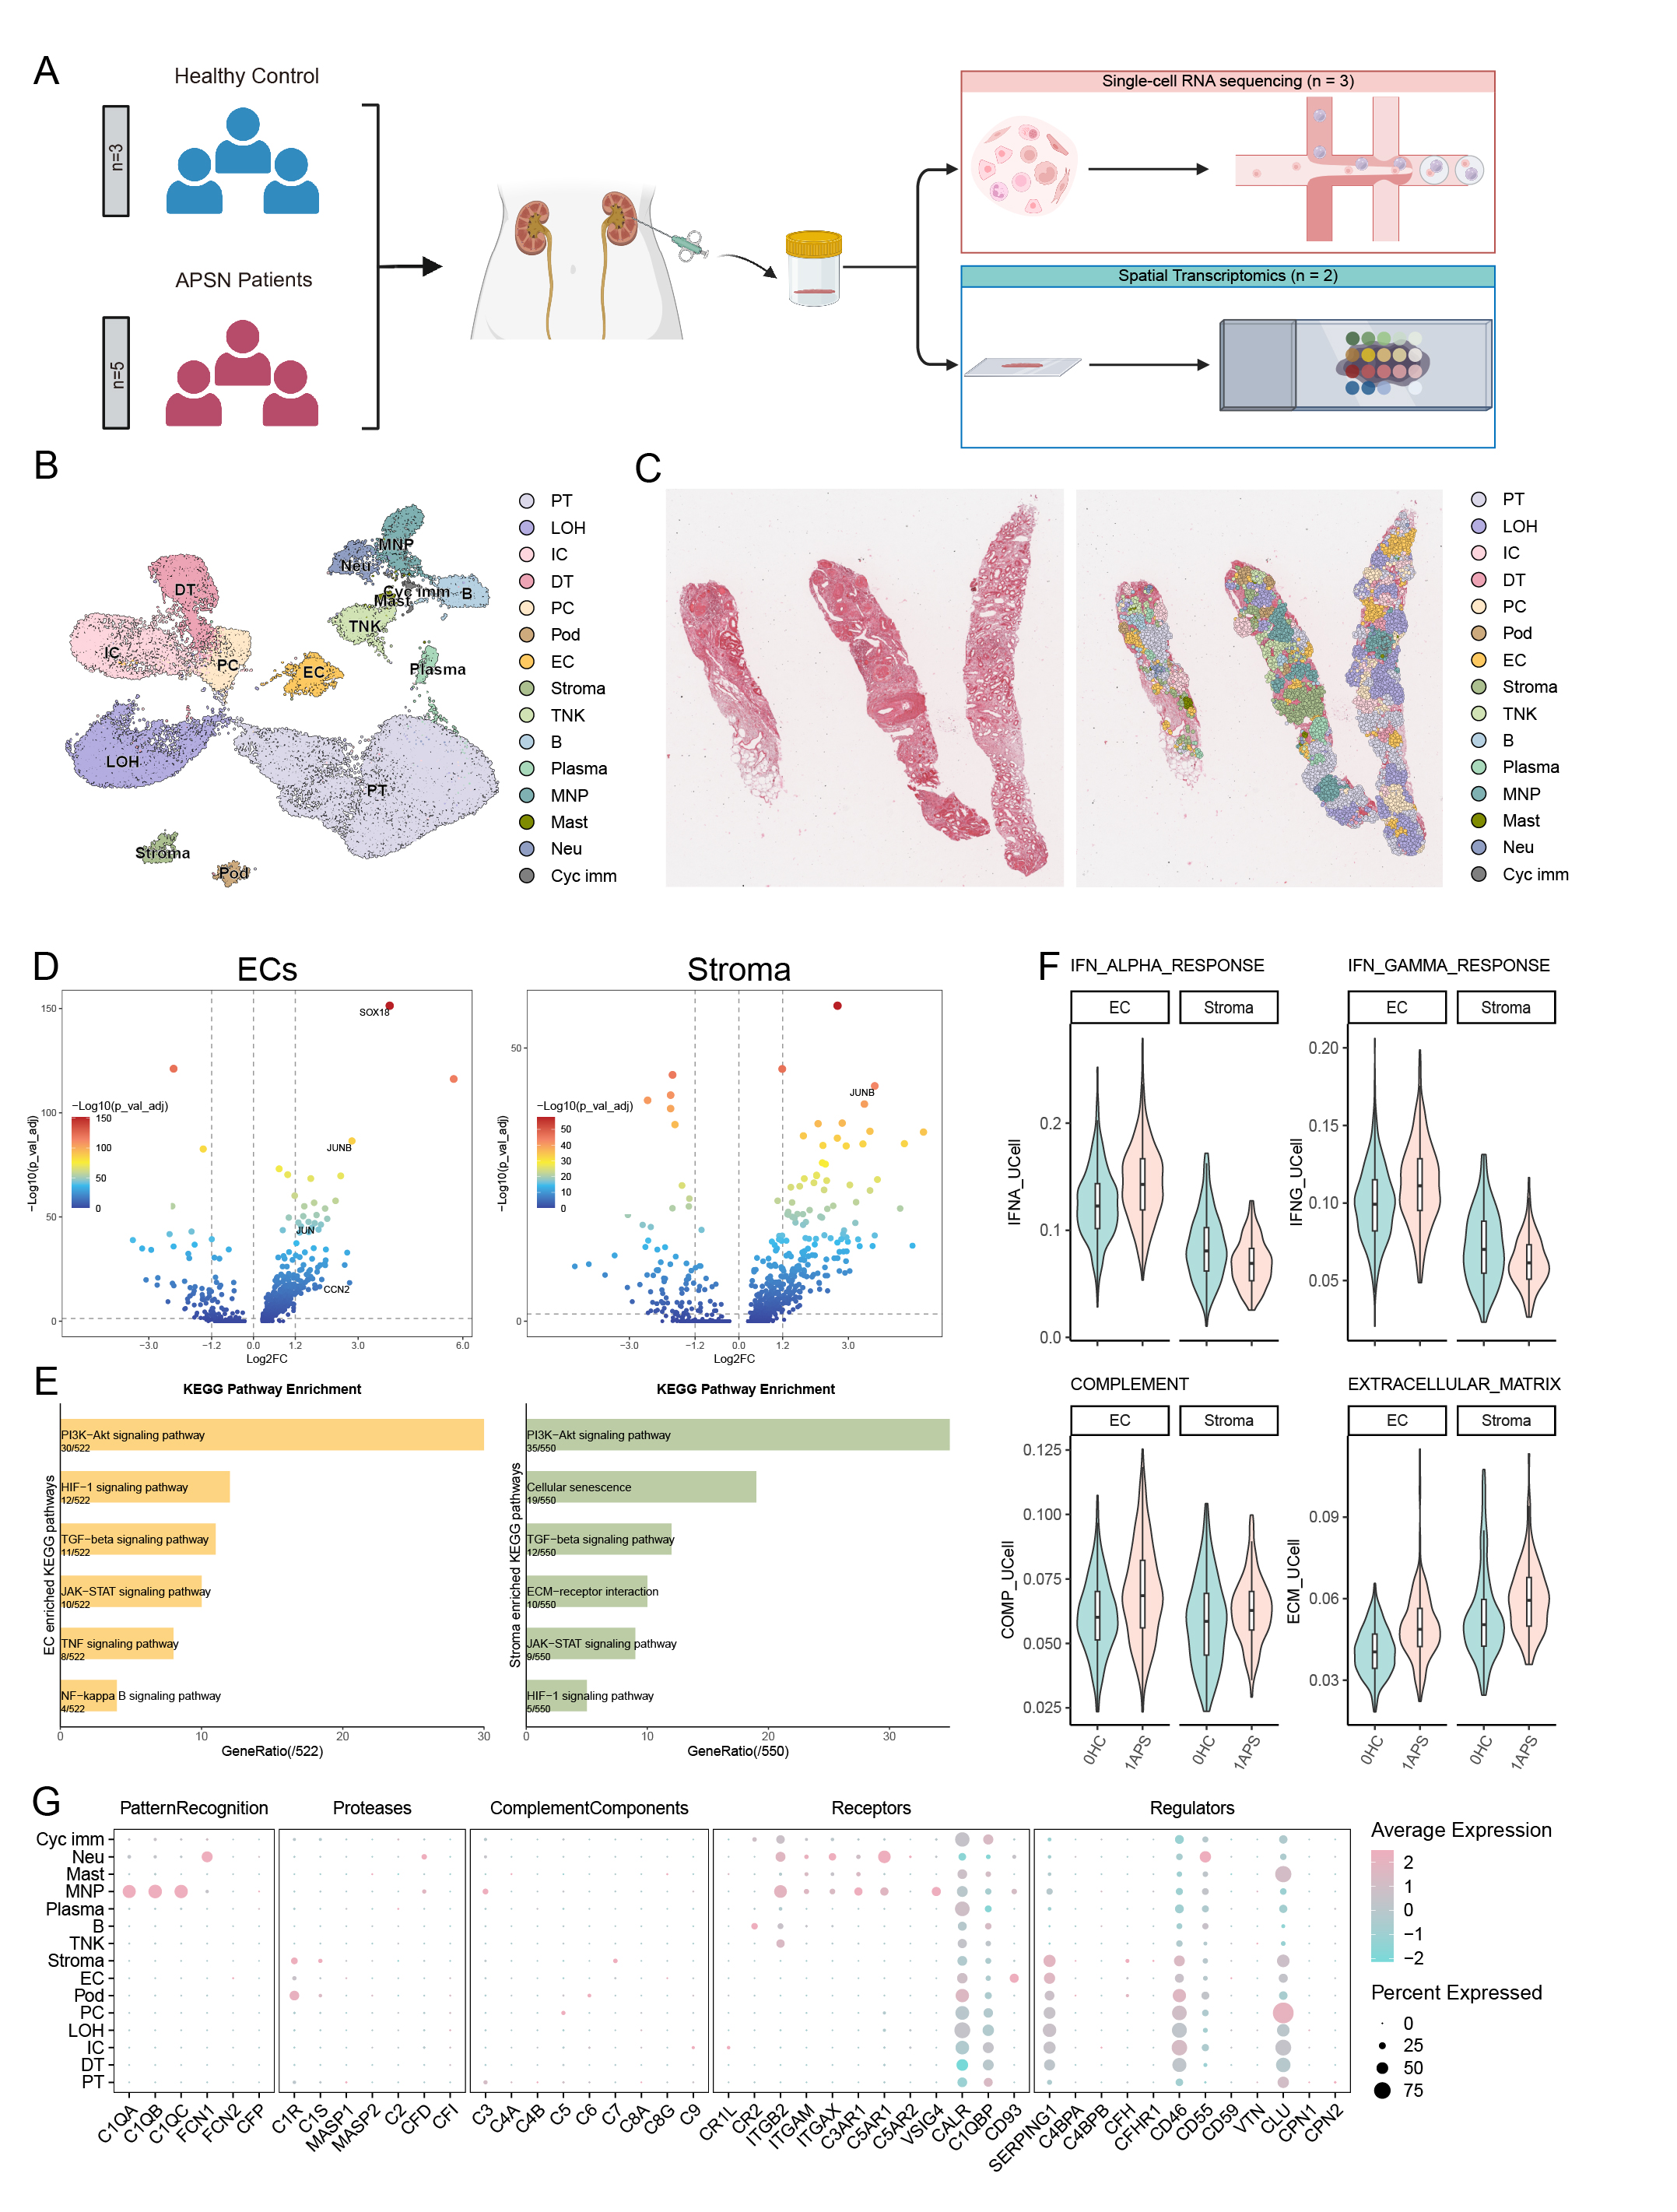 Figure 1. Integrated single-cell and spatial transcriptomic analysis reveals distinct cellular signatures of endothelial and Stroma in aPL nephropathy.
(A) Schematic overview of the experimental design for the study. Kidney biopsy sample from aPL nephropathy (APSN) patients underwent single-cell RNA sequencing (scRNA-seq) (n = 3) and spatial transcriptomics profiling (n = 2). scRNA-seq datasets from 3 healthy controls(HCs) were obtained from GEO database (GSE171458 and GSE171314). (B) UMAP of 34,253 cells in an integrated human kidney scRNA-seq data generated in this study. Annotated cell types are indicated on the plot. (C) Spatial location of identified cell types using Visium. Left, haematoxylin and eosin (H&E)-stained tissue. Right, Celltrek cell-type imputations of the Visium spatial data annotations showing the location of different cell types in the kidney biopsy sample of APSN patient. (D) Volcano plot of DEGs in both ECs(left) and Stroma(right) of APSN patients compared with HCs. (E) Enriched KEGG enrichment analysis utilizing intersect DEGs in both ECs(left) and Stroma(right) of HC and APSN patients. (F) Violin plot showing estimated IFNA scores (top left), IFNG scores (top right), complement scores (bottom left) and ECM scores (bottom right) in ECs and stromal cell clusters calculated by UCELL. (G) Dot plot illustrating the expression pattern of all complement genes in various cell types annotated in the single cell transcriptome data. PT, proximal tubule cells; LOH, Loop of Henle cells; IC, intercalated cells; DT, distal tubule cells; PC, principal cells; Pod, podocytes; EC, endothelial cells; Stroma, stromal cells; TNK, T and NK cells; B, B cells; Plasma, plasma cells; MNP, mononuclear phagocytes; Mast, mast cells; Neu, neutrophils; Cyc imm, cycling immune cells.
.jpg) Figure 2. Complement Pathway Activation in Endothelial Subtypes Associates with Endothelial-Mesenchymal Transition
Figure 2. Complement Pathway Activation in Endothelial Subtypes Associates with Endothelial-Mesenchymal Transition
(A)UMAP projection of 2,027 endothelial and stromal cells showing twelve transcriptionally distinct subclusters. (B) UMAP visualizing the predicted ECs and Stroma lineage trajectory using scvelo. (C) Dot plot displaying average expression (color) and proportion of cells (size) for representative marker genes across endothelial and stromal subclusters. (D) UMAP depicting the estimated gene set signatures of arteries (left), capillaries (middle), and veins (right) calculated using UCELL. (E) Correlation plot between each geneset score calculated by UCELL. (F)Violin plot showing estimated ECM scores (top) and complement scores (bottom) in ECs and stromal cell subclusters calculated by UCELL. (G) Correlation between CCN2 expression and complement scores (bottom) geneset scores from each endothelial subcluster. (H) AEA and VSMC, ECM and complement gene-expression score in the SP datasets using Visium. H&E sections shown on the left of the figure show individual tissue histology of our Visium sections.
AEA, afferent/ efferent arteriole; AVR, ascending vasa recta; DVR, descending vasa recta; GC, glomerular capillary; PTC1, peritubular capillary type 1; PTC2, peritubular capillary type 2; Mes, mesangial cell; Fib, fibroblast; VSMC, vascular smooth muscle cell.
To cite this abstract in AMA style:
Yu S, Pan H, Qian J, Wei X, Fan Y, Yang Z, Gu S, Wu J, Wang C, Zhou T, Shi H. Integrated Single-Cell and Spatial Transcriptomics Reveal Vascular and Immune Pathogenesis in APS Nephropathy [abstract]. Arthritis Rheumatol. 2025; 77 (suppl 9). https://acrabstracts.org/abstract/integrated-single-cell-and-spatial-transcriptomics-reveal-vascular-and-immune-pathogenesis-in-aps-nephropathy/. Accessed .« Back to ACR Convergence 2025
ACR Meeting Abstracts - https://acrabstracts.org/abstract/integrated-single-cell-and-spatial-transcriptomics-reveal-vascular-and-immune-pathogenesis-in-aps-nephropathy/