Session Information
Session Type: Poster Session B
Session Time: 10:30AM-12:30PM
Background/Purpose: Low-grade, prolonged inflammation of involved joint is characteristic of osteoarthritis (OA) pathogenesis. Thus susceptibility to inflammation has been considered as a risk factor for OA. Peripheral insulin resistance is state of ineffective insulin action in peripheral tissues leading to hyperinsulinemia and impaired lipid and glucose homeostasis. Increased peripheral insulin resistance is a known risk factor of type 2 diabetes mellitus and cardiovascular diseases, and it is also known that susceptibility to inflammation increases as insulin resistance increases. In this study, we aimed to investigate correlation between insulin resistance and knee osteoarthritis based on Korea National Health And Nutrition Examination Survey (KNHANES).
Methods: The KNHANES is a cross-sectional survey which includes physical examination, blood test results and health-related interviews. The KNHANES from 2009 to 2013 data were analyzed as it contains knee radiology findings, and 11,211 study population was analyzed. Knee osteoarthritis was defined as Kellgren-Lawrence grade 2 or higher of plain knee radiographic findings, along with the presence of knee joint pain. Recent studies suggested several methods to calculate peripheral insulin resistance without measuring insulin from blood, for instance, METS-IR and TyG index and TyG/HDL ratio. Among them, METS-IR was used in this study as it is known to represent the peripheral insulin resistance most accurately. Multivariable-adjusted logistic regression analyses were performed to investigate the association between METS-IR and knee osteoarthritis. The calculation for METS-IR value is following; METS-IR: ln [(2 × FBG (mg/dL) + serum TG level (mg/dL)] × BMI (kg/m2) / ln [serum HDL-C level (mg/dL)]
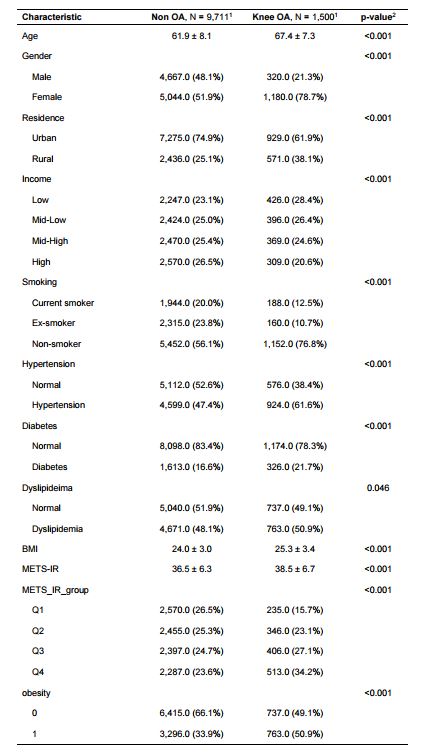
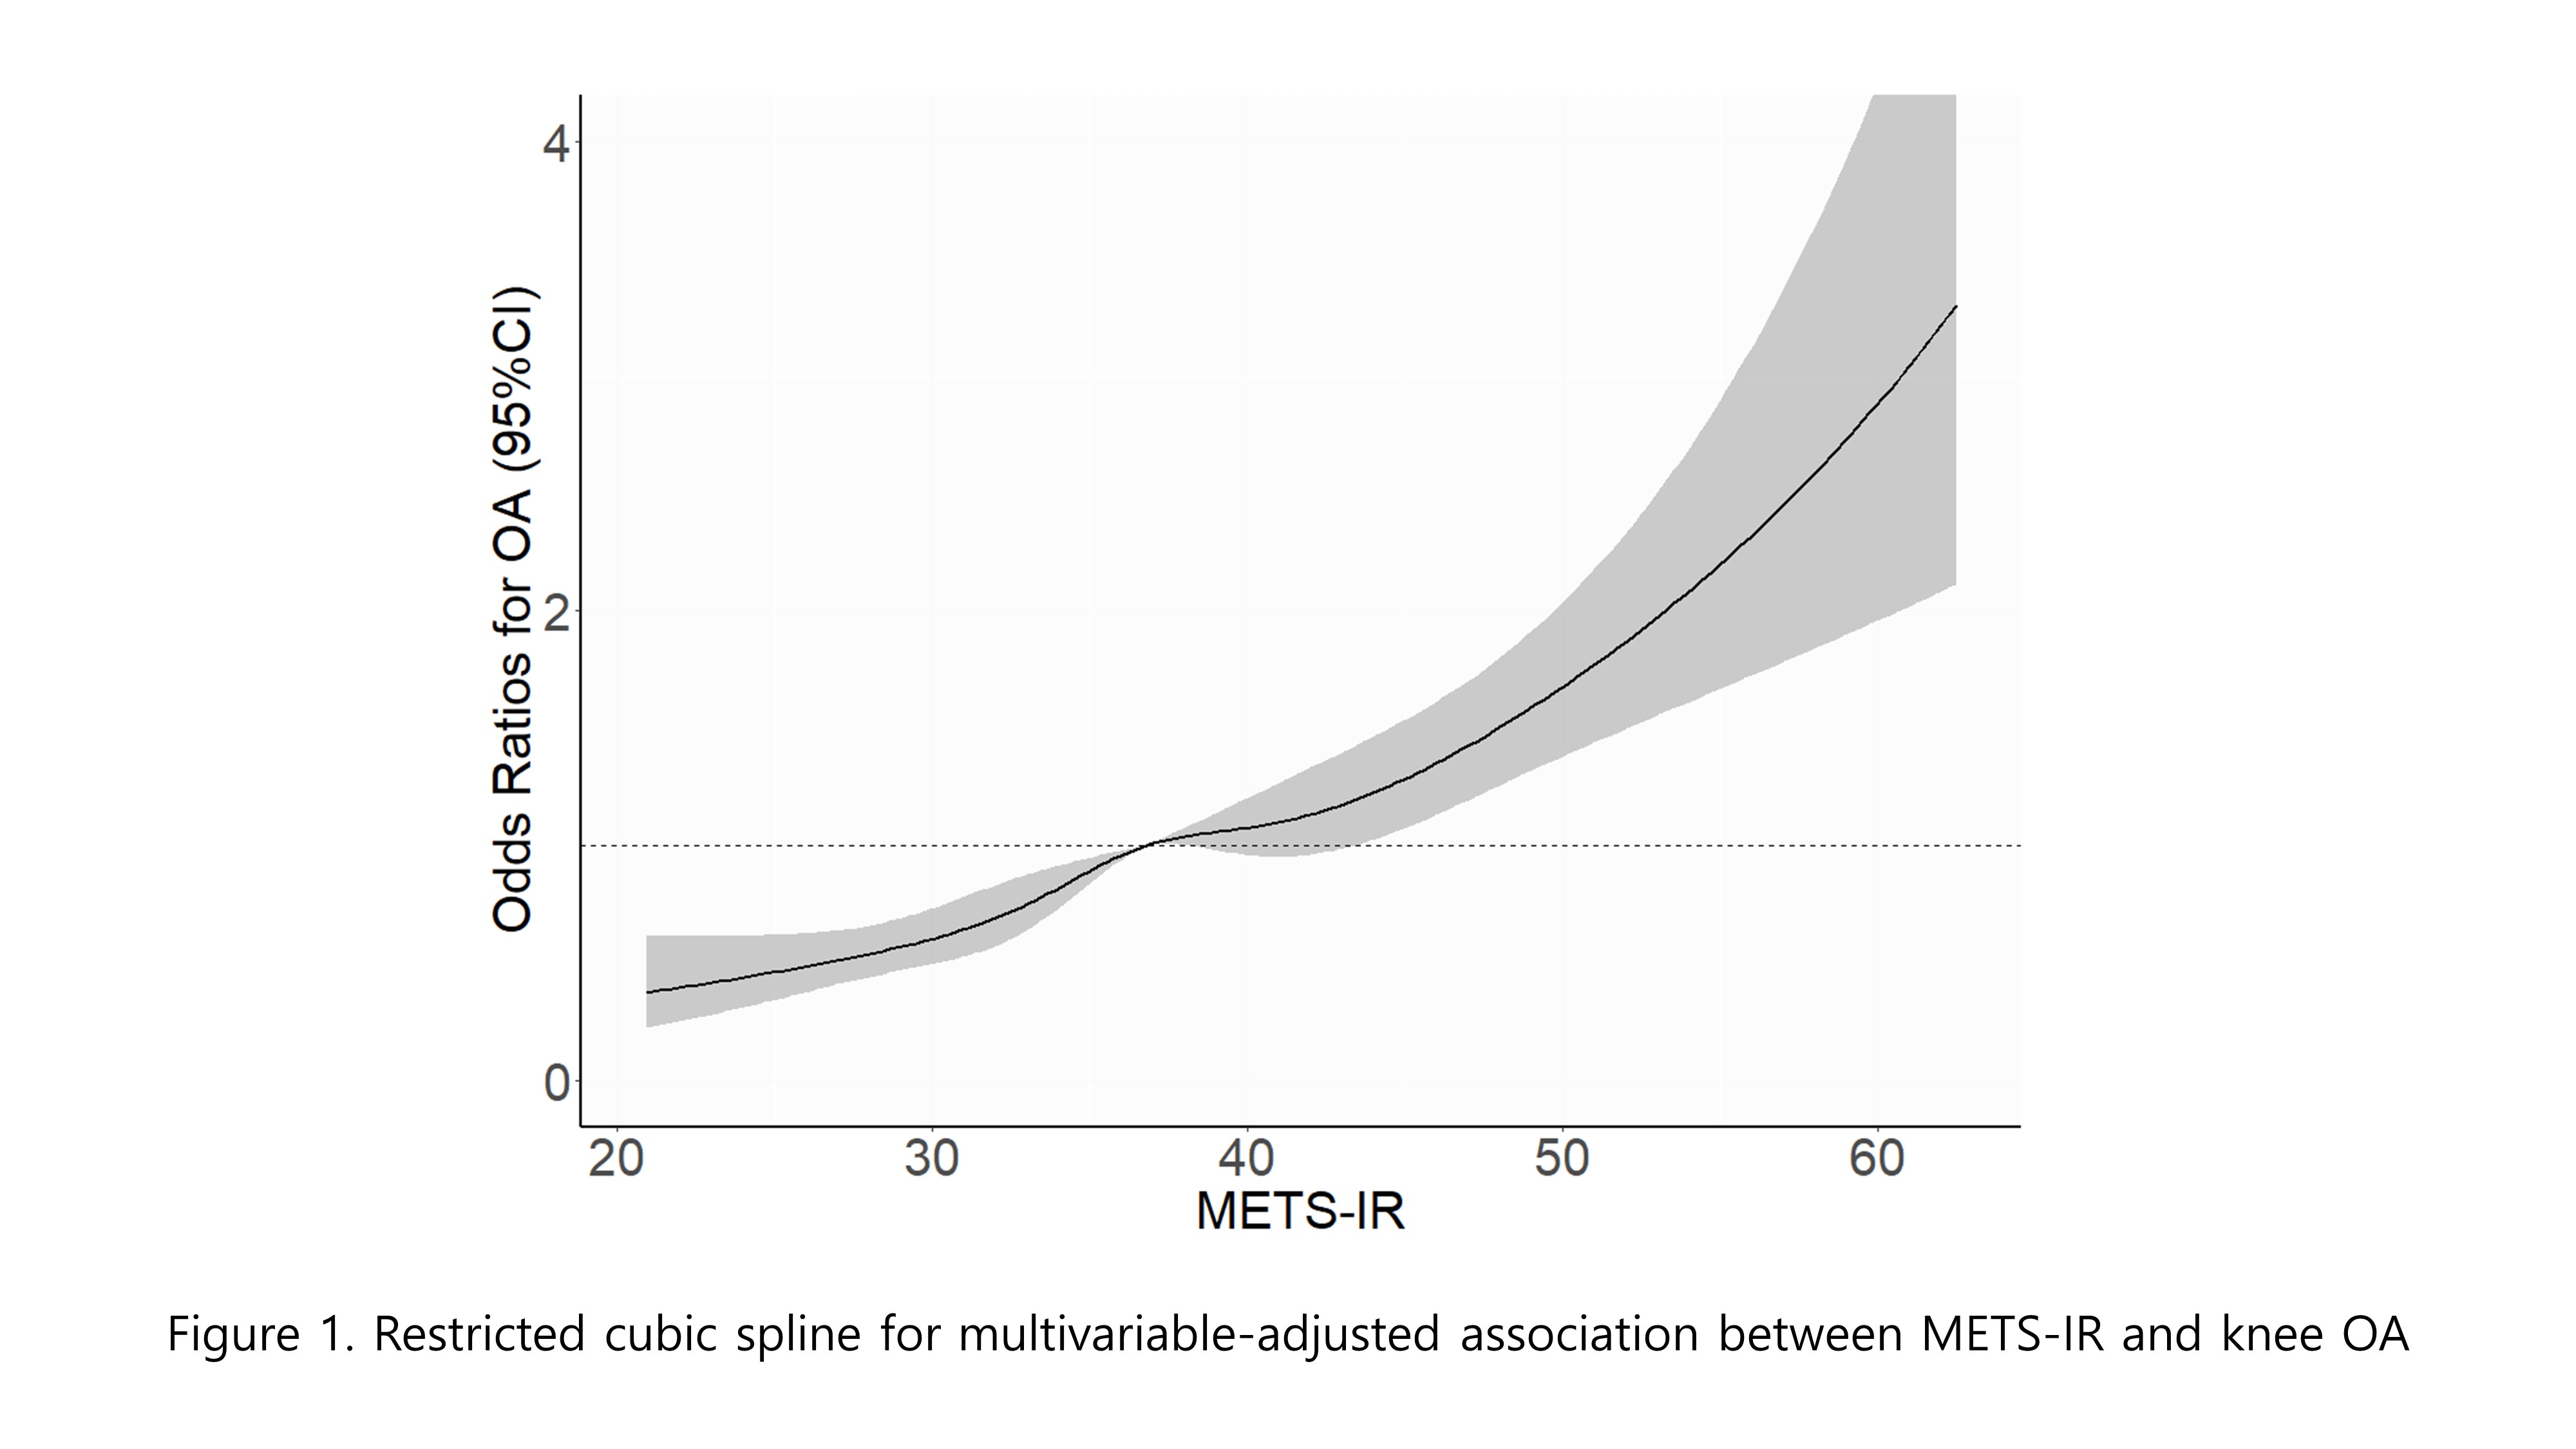
Results: Baseline characteristics of non-OA group and OA group are presented in Table 1. Following knee OA definition, 1500 patients (13.3%) were classified into knee OA group. The multivariable-adjusted odds ratios (OR) and 95% confidence intervals (CI) for METS-IR and knee osteoarthritis compared to Q1 are as follows; Q2: 1.58 (1.39-1.79), Q3: 1.95 (1.71-2.22), Q4: 2.84 (2.47-3.26). Continuous multivariable-adjusted association between METS-IR and knee osteoarthritis is presented with a restricted cubic spline in Figure 1.
Conclusion: People with higher insulin resistance (higher METS-IR value) had higher odds ratio for knee OA. Further studies using insulin resistance value with serum insulin level would be required to reveal the exact correlation between insulin resistance and knee OA.
To cite this abstract in AMA style:
Park J, Son M, Lee S, Chung W, Lee S. Association Between Metabolic Markers and Knee Osteoarthritis: A Cross-sectional Study Using the Korea National Health and Nutrition Examination Survey 2009 to 2013 [abstract]. Arthritis Rheumatol. 2024; 76 (suppl 9). https://acrabstracts.org/abstract/association-between-metabolic-markers-and-knee-osteoarthritis-a-cross-sectional-study-using-the-korea-national-health-and-nutrition-examination-survey-2009-to-2013/. Accessed .« Back to ACR Convergence 2024
ACR Meeting Abstracts - https://acrabstracts.org/abstract/association-between-metabolic-markers-and-knee-osteoarthritis-a-cross-sectional-study-using-the-korea-national-health-and-nutrition-examination-survey-2009-to-2013/


