Session Information
Session Type: Abstract Session
Session Time: 3:00PM-3:50PM
Background/Purpose: Altered eicosanoids have been linked to rheumatoid arthritis (RA), suggesting an enhanced metabolization. Eicosanoid metabolism forms a complex network, involving different pathways and mediators, including oxylipins, which are known to modulate inflammation. However, the role of oxylipins in RA is still to be elucidated. This study aims to characterize oxylipins networks during the earliest phases of RA and evaluate their associations with clinical features.
Methods: 60 early RA patients (2010 ACR/EULAR criteria), 11 clinically suspect arthralgia (CSA) individuals and 28 control subjects (HC) were recruited. Serum samples were collected at onset, and treatment-naïve patients (n=50) were prospectively followed-up upon csDMARD treatment.
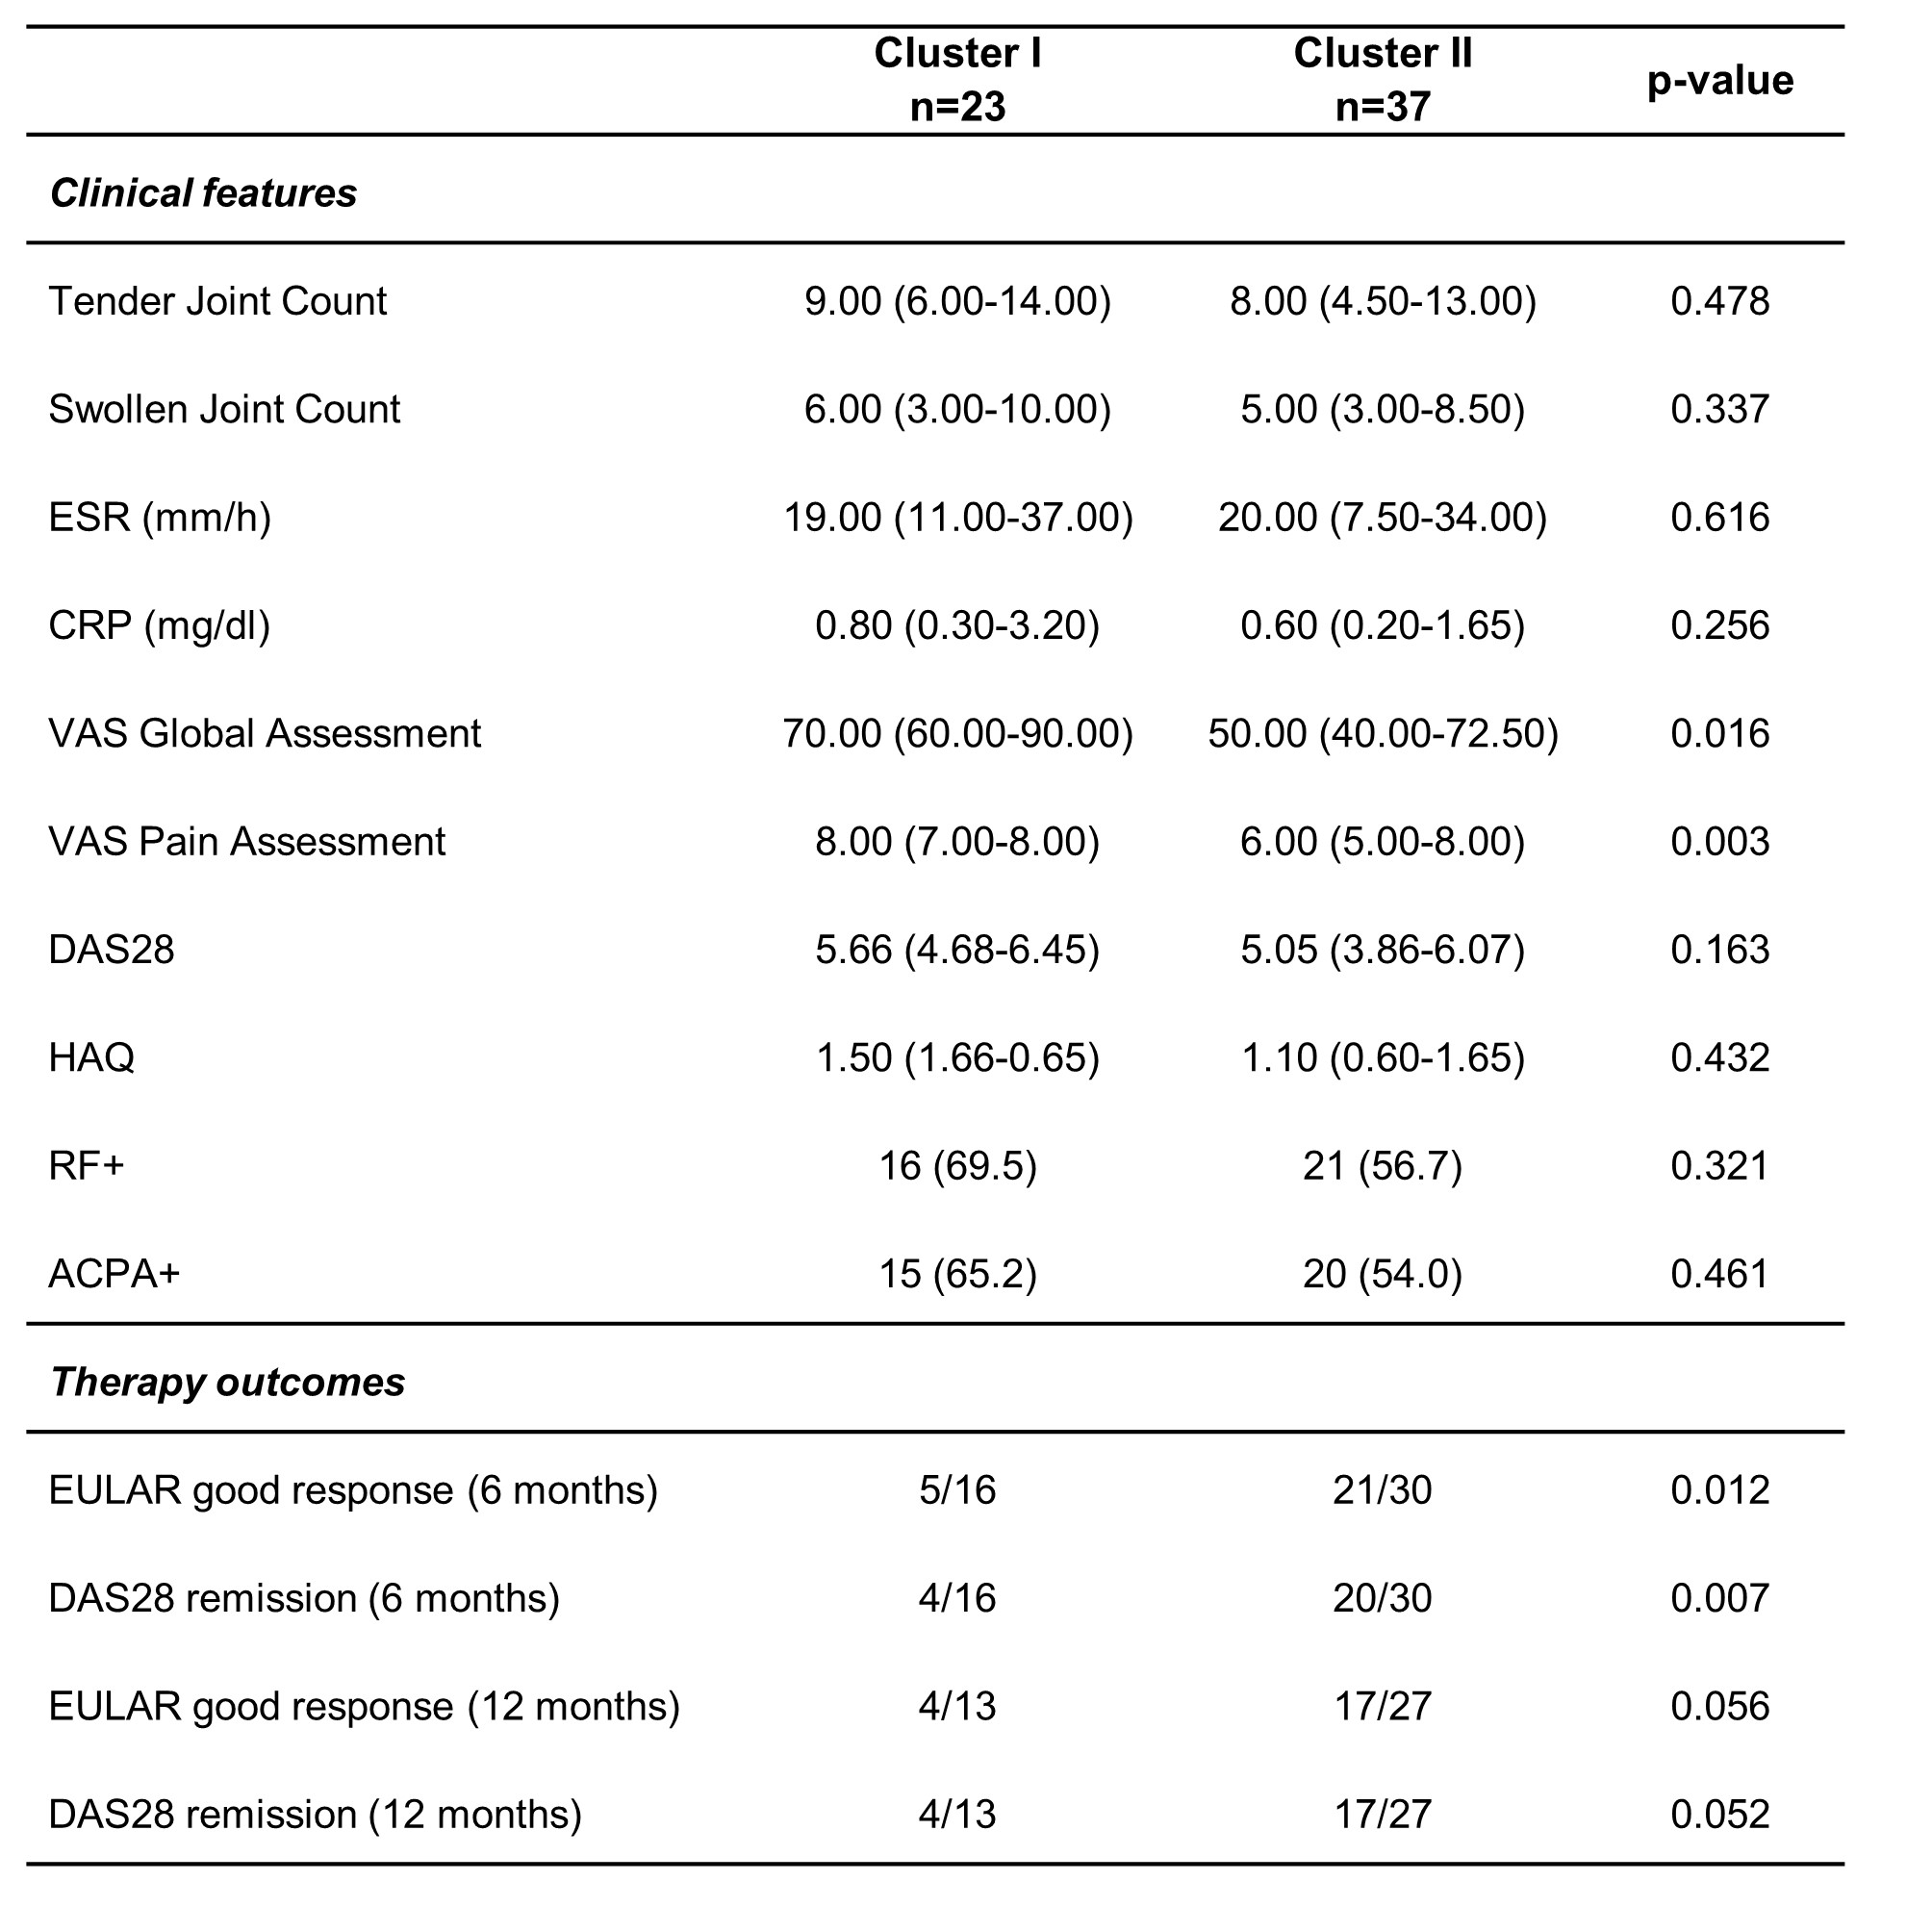
Results: 75 oxylipins, mostly derived from arachidonic, eicosapentanoic and linoleic acids, were identified by LC-MS/MS. Differences in serum levels of 14 oxylipins across HC, CSA and RA were found, exhibiting different trajectories. Network analyses revealed strong differences in the association among oxylipins, with a clear grouping in RA and a fuzzy network with high degree and closeness found in CSA (Figure 1). PLS-DA did not provide a neat separation of groups, but cluster analysis based on oxylipins with VIP scores >1 (n=22) allowed the identification of two clusters. Cluster usage differed among groups (p=0.003) (Figure 2), and showed associations with disease severity and low rates of remission at 6 and 12 months in treatment-naïve RA (Figure 3). Pathway enrichment analyses revealed different precursors and pathways highlighting the relevance of AA and LOX pathway in CSA and RA, respectively.
Conclusion: oxylipins networks differ across stages during earliest phases of RA. Oxylipins can inform on pathways with clinical relevance for disease progression, clinical heterogeneity and treatment response.
 Figure 1. Network analyses based on the concentration of oxylipins in the different study groups. Each node corresponds to a single oxylipin, numbered as per the figure legend list. Node colours represent the fatty acid precursor as follows: red (AA), green (DHA), dark blue (EPA), light blue (LA), turquoise (DHGLA), orange (ALA) (orange), magenta (OA). The lines between nodes illustrate the strength (width) and type (green: positive, red: negative) of the correlations between each pair of oxylipins. The relative position of the nodes parallels its degree of correlation that is, nodes more closely correlated locate closer to each other.
 Figure 2. Heatmap and cluster analysis based on oxylipins that best separate the groups. Tiles were coloured based on concentrations, red and blue indicating high and low levels respectively, as indicated in the legend (top right). Upper bar indicates group classes (HC: blue, CSA: green, RA: red). Heatmap allowed the identification of two clusters (bottom).
 Figure 3. Clinical features of RA patients based on oxylipins clusters. Variables were expressed as median (interquartile range) or n(%), unless otherwise stated. Differences were assessed by Mann-Withney or chi-square tests (or Fisher exact test, when appropriate), according to the distribution of the variables.
To cite this abstract in AMA style:
Coras R, Rodríguez-Carrio J, Alperi-López M, López P, Ulloa C, Ballina-García F, Armando A, Quehenberger O, Guma M, Suárez A. Oxylipins Profiles During the Earliest Phases of Rheumatoid Arthritis: Associations with Clinical Stage and Treatment Outcomes [abstract]. Arthritis Rheumatol. 2020; 72 (suppl 10). https://acrabstracts.org/abstract/oxylipins-profiles-during-the-earliest-phases-of-rheumatoid-arthritis-associations-with-clinical-stage-and-treatment-outcomes/. Accessed .« Back to ACR Convergence 2020
ACR Meeting Abstracts - https://acrabstracts.org/abstract/oxylipins-profiles-during-the-earliest-phases-of-rheumatoid-arthritis-associations-with-clinical-stage-and-treatment-outcomes/
