Session Information
Date: Saturday, November 7, 2020
Title: RA – Treatments Poster II: Comparative Effectiveness, Biosimilars, Adherence & the Real World
Session Type: Poster Session B
Session Time: 9:00AM-11:00AM
Background/Purpose: Numerous clinical trials have been published in rheumatoid arthritis (RA), but comparing efficacies of disease-modifying anti-rheumatic drugs (DMARDs) is complicated by a lack of head-to-head studies and because study populations are heterogeneous. We aimed to identify and adjust for patient/trial characteristics associated with clinical response to enable fairer comparisons between different drugs/drug classes, e.g. abatacept (co-stimulation modulator) vs. adalimumab (TNFi).
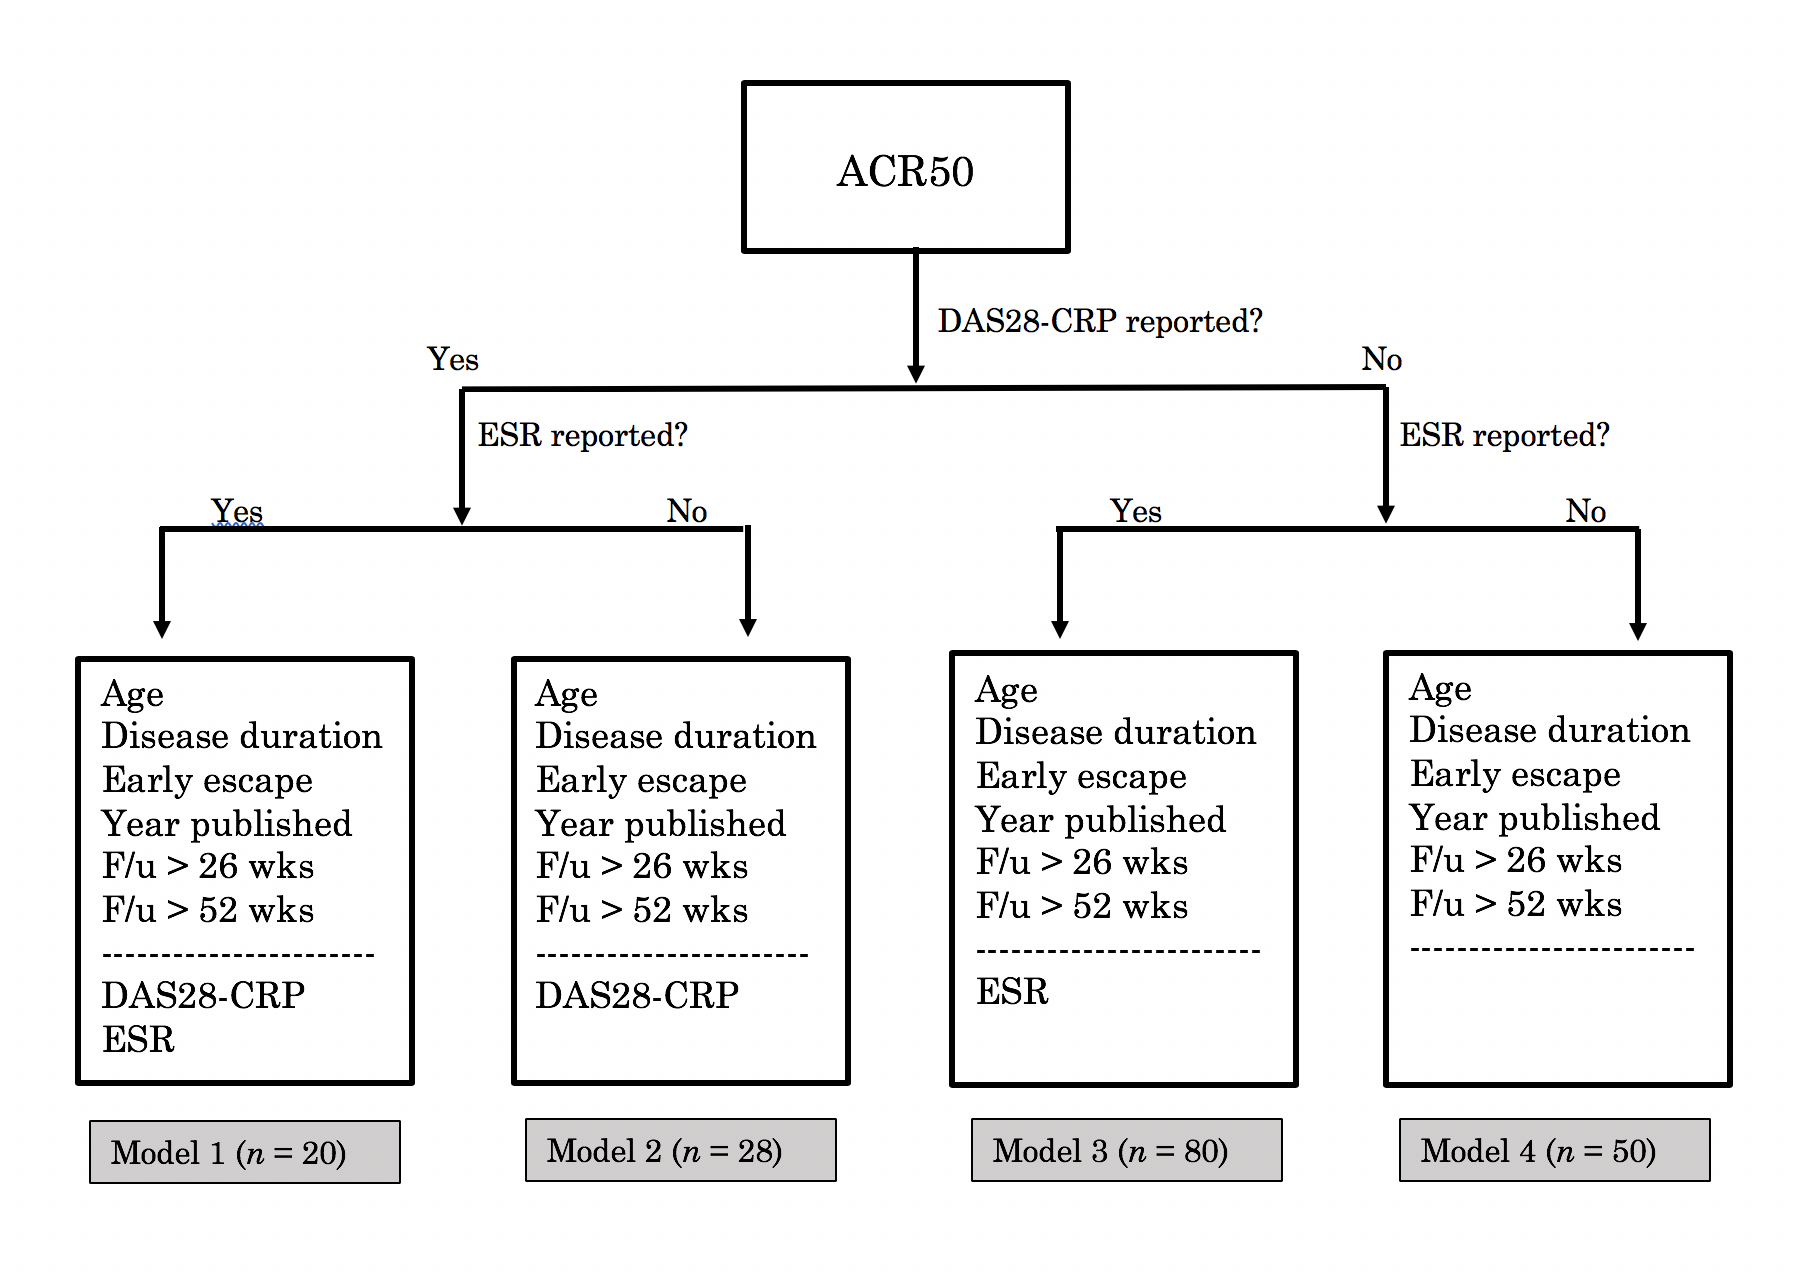
Methods: We reviewed 565 DMARD clinical trial papers using the following criteria: studies had to be randomized, controlled, Phase III trials published after 1995 reporting ACR20/50/70 with follow-up > 6 months. 73 met criteria. We explored associations between 33 patient/trial characteristics and ACR response. We constructed models incorporating these factors to compute predicted ACR response rates for each trial arm and their residual differences from actual response rates. Some factors associated with response weren’t reported in every study, so ACR20, 50, and 70 each required constructing multiple models to allow for different numbers of independent variables. The model used for a given trial arm was selected based on the information available (algorithm for ACR50 shown in Fig. 1).
Results: Based on linear regressions, multiple patient/trial characteristics were associated with ACR response, including age, calendar year of publication, DAS28-CRP, disease duration, and prior MTX/biologic use (Table 1). Trials with patients having greater disease duration at enrollment had lower response rates. Similarly, previous therapy failure (MTX or biologics) was associated with poorer response in trials. Conversely, trials with patients having higher baseline disease activity as characterized by DAS28-CRP (but not by DAS28-ESR) had higher response rates. Sex, white race, swollen/tender joint counts, and RF serostatus weren’t associated with response. Several variables were associated with ACR70 response only, including steroid usage, anti-CCP serostatus, and ESR.
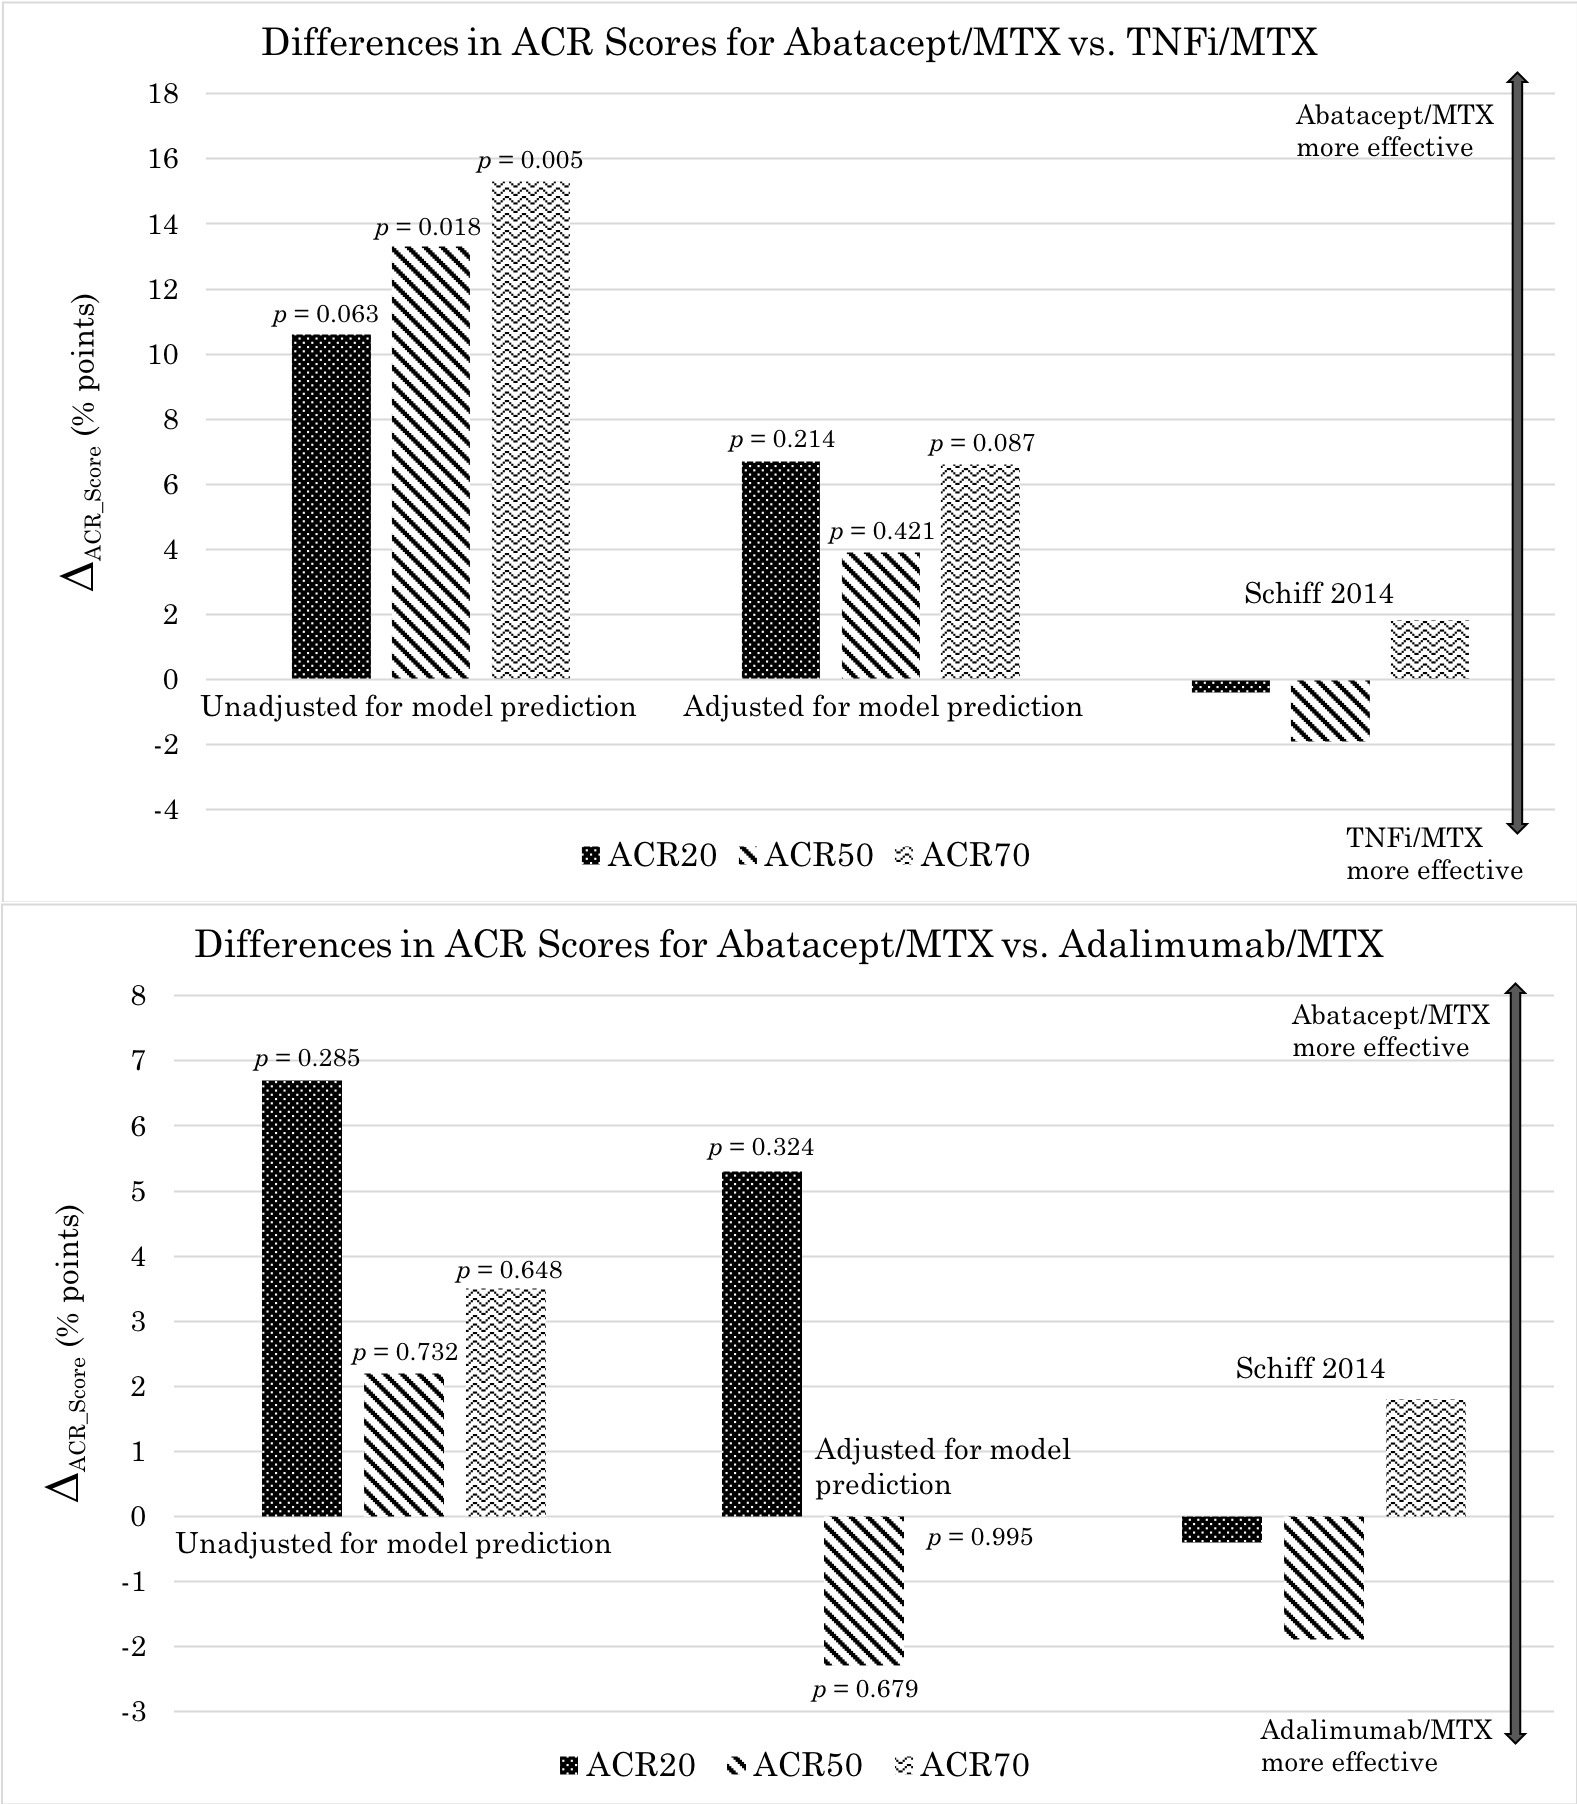
Before adjusting for the model predictions, ACR response rates were higher for abatacept compared to TNFi (both with MTX). The differences in average ACR20, 50, and 70 response rates, respectively, were 10.6 (p = 0.063), 13.3 (p = 0.018), and 15.3 (p = 0.005) percentage points, in favor of abatacept (Fig. 2). After adjustment, the differences were smaller and non-significant: 6.7 (p = 0.214), 3.9 (p = 0.421), and 6.6 (p = 0.087) points. These findings are more comparable to those reported in a direct head-to-head study by Schiff et. al. in 2014—between-group differences of -0.4, -1.9, and 1.8 points, respectively.
Conclusion: We identified factors associated with ACR response in RA clinical trials, awareness of which may inform interpretation of therapy response rates. Adjusting for them could enable more appropriate efficacy comparisons across therapies studied in different settings. In the case of abatacept vs. TNFi, adjustment via the predictive models we developed yielded results more similar to results of an existing head-to-head trial. These models may be useful for comparing other drugs/drug classes, particularly when no head-to-head trial exists.
 Figure 1: Choosing among four models for predicting an ACR50 score. Here n denotes the number of treatment arms for which a given model applied. Variables above the dashed line were reported in every treatment arm and are included in every model. Those below the line were not reported in some treatment arms. Calculating ACR50 scores for such arms required models not taking those variables as inputs.
 Table 1: Simple linear regression coefficients from modeling ACR response rates as functions of patient/trial characteristics. N represents the number of observations for a given association, i.e. how many treatment arms contained both the independent and dependent variables of interest. Statistically significant associations are bolded with * = p < 0.05, ** = p < 0.01, and *** = p < 0.001.
 Figure 2: Differences in ACR response rates for abatacept vs. TNFi (comparison based on drug class) and abatacept vs. adalimumab (comparison based on drug)—all combined with MTX—unadjusted and adjusted for predictive models. Here ACR response rates for TNFi or adalimumab have been subtracted from those for abatacept, thus the positive vertical axis corresponds to superior efficacy for abatacept.
To cite this abstract in AMA style:
Cordisco A, Baker J. Identification and Adjustment for Factors Associated with Clinical Response in Rheumatoid Arthritis Clinical Trials to Improve Comparisons of Treatment Efficacy [abstract]. Arthritis Rheumatol. 2020; 72 (suppl 10). https://acrabstracts.org/abstract/identification-and-adjustment-for-factors-associated-with-clinical-response-in-rheumatoid-arthritis-clinical-trials-to-improve-comparisons-of-treatment-efficacy/. Accessed .« Back to ACR Convergence 2020
ACR Meeting Abstracts - https://acrabstracts.org/abstract/identification-and-adjustment-for-factors-associated-with-clinical-response-in-rheumatoid-arthritis-clinical-trials-to-improve-comparisons-of-treatment-efficacy/
