Session Information
Session Type: Poster Session (Sunday)
Session Time: 9:00AM-11:00AM
Background/Purpose: The potential of thermal imaging in detecting joint inflammation in rheumatoid arthritis (RA) has not been well studied or compared with other approaches in assessing joint inflammation. Therefore, we aimed to gain further insight into the role of thermal imaging in RA by performing a comparative analysis with ultrasound (US) and clinical joint assessment.
Methods: 22 joint (including bilateral wrists, metacarpophalangeal joints, thumbs interphalangeal joints and proximal interphalangeal joints) were studied per patient. At the joint sites, thermographic parameters included maximum (Tmax), minimum (Tmin), average (Tavg) and Tmax minus Tmin (Tmax-min) temperatures, US parameters collected at the same study visit included power Doppler (PD) and grey-scale (GS) joint inflammation (graded semi-quantitatively 0-3), while clinical assessment included joint swelling and tenderness (graded yes=1 or no=0). As imaging findings for different joints in the same patient may not be independent, Generalized Estimating Equations (GEE) analysis was used to (a) compare the differences in mean values of thermographic parameters between joints based on their PD or GS positivity/negativity status (b) compare the differences in mean values of thermographic parameters, US PD and GS scores between joints based on their clinical swelling and tenderness status. Differences in means and 95% CIs were estimated using GEE with robust Huber-White variance estimates.
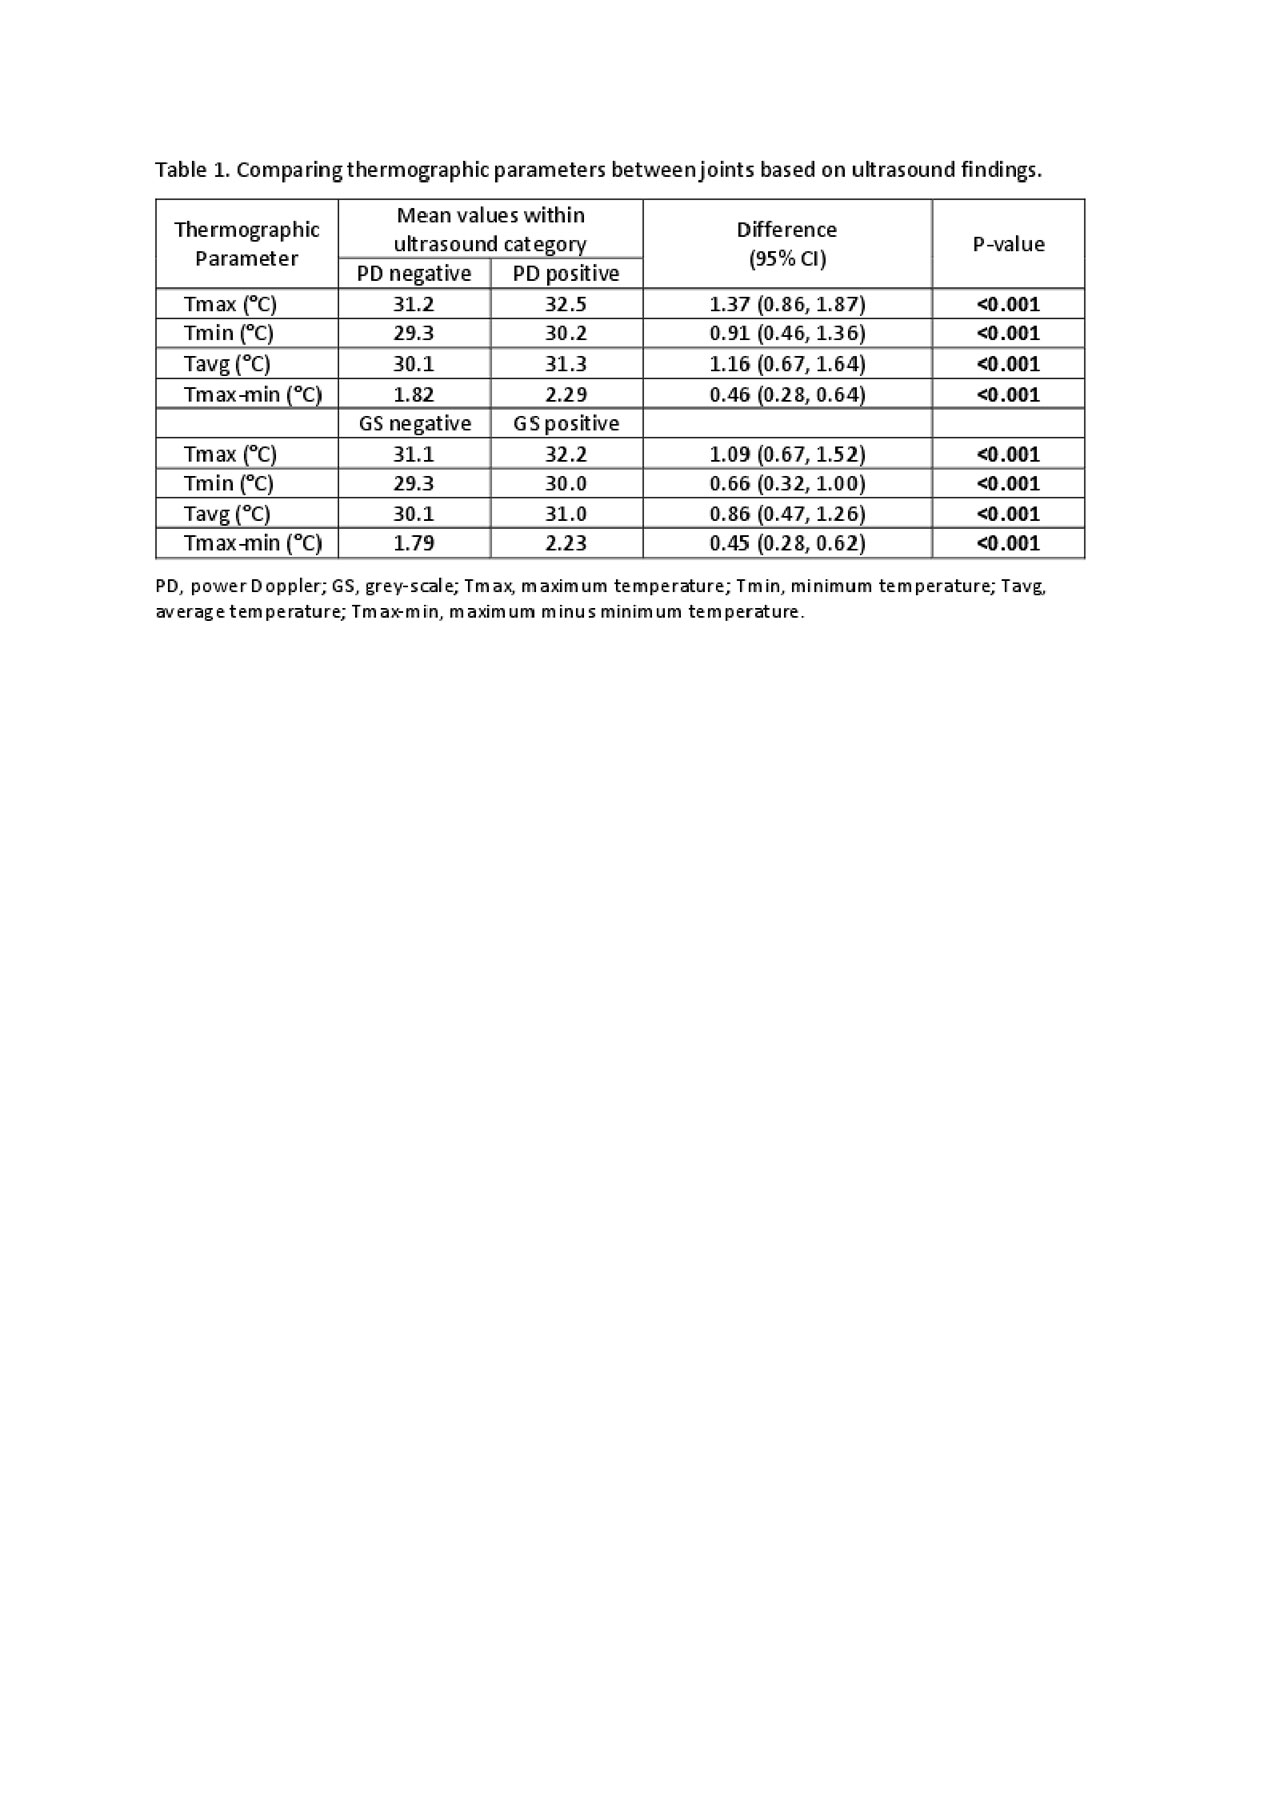
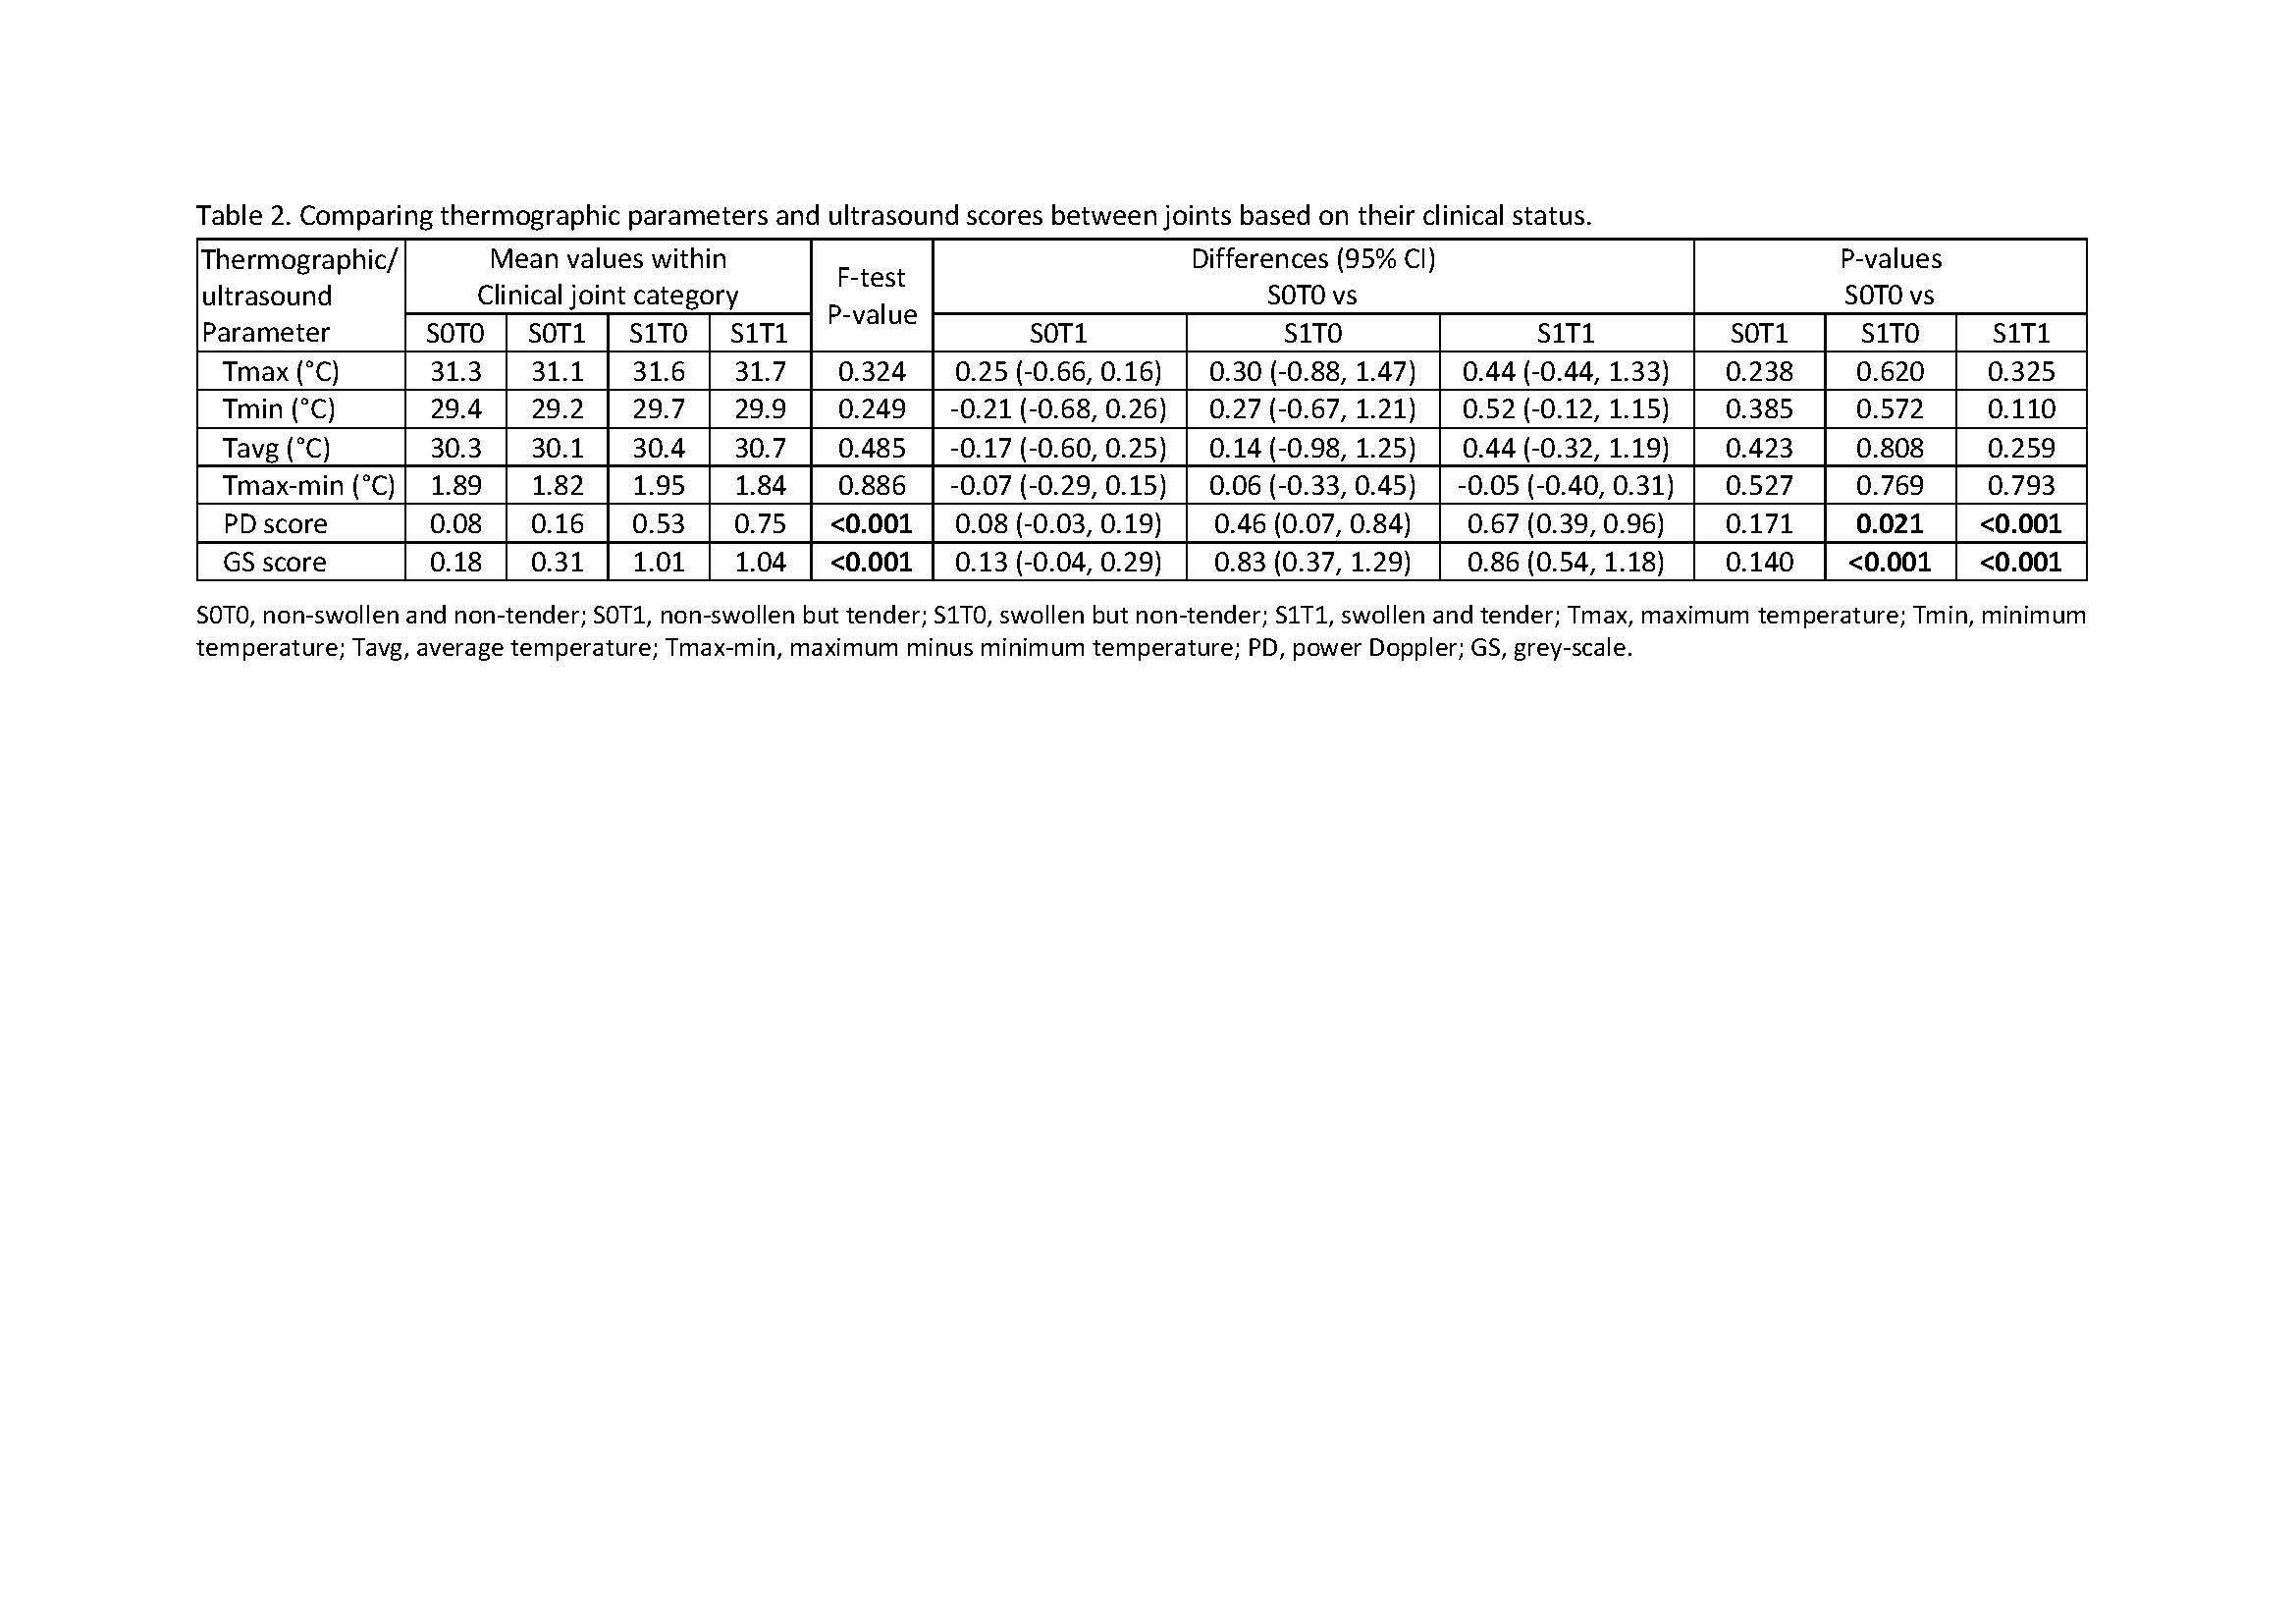
Results: 814 joints were studied in 37 RA patients with the following baseline characteristics: mean age, 56.5 years; 75.7% female; 75.7% Chinese; mean (SD) disease duration, 30.9 (45.3) months; mean (SD) DAS28, 4.43 (1.12). Comparing joints with PD positivity versus those with PD negativity (table 1), the differences in mean values (95% CI) for thermographic parameters Tmax, Tmin, Tavg and Tmax-min had all attained statistical significance (P-values were all < 0.001). The corresponding differences in mean values (95%CI) for the thermographic parameters comparing joints with GS positivity versus those with GS negativity (table 1) were similarly statistically significant (P-values were all < 0.001). The differences in mean values (95% CI) for PD and GS scores—but not for thermographic parameters—were statistically significant for (a) swollen and tender joints (PD: 0.67 (0.39, 0.96), P< 0.001; GS: 0.86 (0.54, 1.18), P< 0.001) and (b) swollen and non-tender joints (PD: 0.46 (0.07, 0.84), P=0.021; GS: 0.83 (0.37, 1.29), P< 0.001) when compared to non-swollen and non-tender joints (table 2).
Conclusion: Thermographic parameters were useful in discriminating between US PD and GS positivity versus negativity status at the RA joints, although they were not useful—unlike ultrasonography—for discriminating between joints based on clinical swelling and tenderness status.
To cite this abstract in AMA style:
Tan Y, Hong C, Li H, Allen Jr J, Thumboo J. Thermal Imaging in Rheumatoid Arthritis: A Comparative Analysis with Ultrasonography and Clinical Joint Assessment [abstract]. Arthritis Rheumatol. 2019; 71 (suppl 10). https://acrabstracts.org/abstract/thermal-imaging-in-rheumatoid-arthritis-a-comparative-analysis-with-ultrasonography-and-clinical-joint-assessment/. Accessed .« Back to 2019 ACR/ARP Annual Meeting
ACR Meeting Abstracts - https://acrabstracts.org/abstract/thermal-imaging-in-rheumatoid-arthritis-a-comparative-analysis-with-ultrasonography-and-clinical-joint-assessment/


