Session Information
Session Type: Poster Session (Monday)
Session Time: 9:00AM-11:00AM
Background/Purpose: The assessment of active joints is a core component of widely used outcome measures in rheumatoid arthritis (RA). However, variability exists within and across examiners in clinical assessment of active joint counts.
Our objective was to explore the ability of noncontact digital thermographic imaging to assess inflammatory arthritis activity, compared to clinical and ultrasound (US) evaluation.
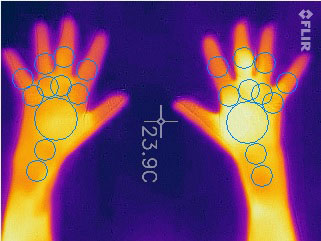
Methods: Cross-sectional pilot study of 20 RA patients (ACR criteria). Each patient had 3 independent (blinded) assessments of their hand joints activity with: 1) clinical with swollen and tender joints counts (SJC, TJC) and DAS28 score; 2) US with mode B and doppler (DP) according to EULAR/OMERACT” guidleines (MyLab60®, Esaote Biomedica, Genoa, Italy, 4–13 MHz broadband linear array transducer), and 3) thermographic assessment. Thermal images were obtained with an infrared thermal cellphone camera FLIR One® and analyzed either with a software detecting 22 predetermined regions of interest (ROI) and either with a simple colour reading (arthritis yes/no) (Figure ). For each ROI, we measured the difference between the ROI temperature and the homolateral forearm considered as reference area (ΔT°). Statistical analysis: Description with mean ± standard deviation (SD), and specificity (Sp) and sensitivity (Se) analysis.
Results: The main characteristics of the 20 RA patients were the following (mean±SD): age: 59.5 years, disease duration: 17.5 years, ACPA+: 85%, TJC: 5.1±5.6, SJC : 3.5±3.2, DAS28: 3.8±1,3. The mean ROI temperature of the 351 analyzed joints was 36.3 °C and the forearm temperature was 36.6°C. Clinical vs thermographic assessment: Mean ΔT° of swollen and tender joints was – 0.42 °C ± 0.74 and –0.15°C± 0.88, respectively versus– 0.36 °C ± 0.85 and– 0.46 °C ± 0.62. Mean ΔT° was – 0.08°C ± 0,4 in DAS28 < 2.6 group , – 0.39°C ± 0.91 in DAS 28 ≥ 2.6 – ≤5.1 [TP1] group and – 0.10 ± 0.64 in DAS 28 > 5.1 group. US vs thermographic assessment: The mean ΔT° of the 22 joints with synovitis DP2 and of the 17 joints with DP3 was – 0.48 °C ± 0.99 and – 0.02 °C ± 0.60, respectively. The simple colour reading was able to detect DP2 synovitis with Sp = 0.92 and Se = 0,24 and DP3 synovitis with Sp = 0.94 and Se = 0,19.
Conclusion: Thermographic assessment with a thermal smartphone camera of RA activity is a promising technology, that still needs further refinement before considering its daily use.
To cite this abstract in AMA style:
Paris C, Lafforgue P, Pradel V, Richez C, Pham T. Rheumatoid Arthritis Activity Assessment with Cellphone Thermal Camera Imaging Compared to Clinical and Ultrasound Assessments [abstract]. Arthritis Rheumatol. 2019; 71 (suppl 10). https://acrabstracts.org/abstract/rheumatoid-arthritis-activity-assessment-with-cellphone-thermal-camera-imaging-compared-to-clinical-and-ultrasound-assessments/. Accessed .« Back to 2019 ACR/ARP Annual Meeting
ACR Meeting Abstracts - https://acrabstracts.org/abstract/rheumatoid-arthritis-activity-assessment-with-cellphone-thermal-camera-imaging-compared-to-clinical-and-ultrasound-assessments/

