Session Information
Session Type: ACR Poster Session C
Session Time: 9:00AM-11:00AM
Background/Purpose: The objective of the study was to investigate long-term survival of low-dose etanercept (ETN) (25 mg weekly) and possible predictors of survival.
Methods: We collected retrospectively data of RA patients starting full-dose ETN (25 mg twice a week) between April 2001 and September 2014 who tapered ETN and maintained low-dose ETN for at least 12 months. Patients were evaluated every 3 months with a treat-to-target approach. Patients who achieved and maintained remission (DAS28 <2.6) for at least 6 months with full-dose ETN, tapered ETN. If remission was lost in two consecutive visits the patient returned to full-dose. We recorded the time to achieve remission with full-dose ETN (TTR). We considered two different cut-offs of TTR: <=6 months and <=12 months. We then evaluated survival of low-dose ETN treatment and possible predictors. Variables collected are reported in Table I. Survival was analysed with Cox-regression. Covariates included were those achieving a p<0.20 in univariate analysis. A separate Cox regression analysis was run with TTR<=6 months and TTR<=12 months.
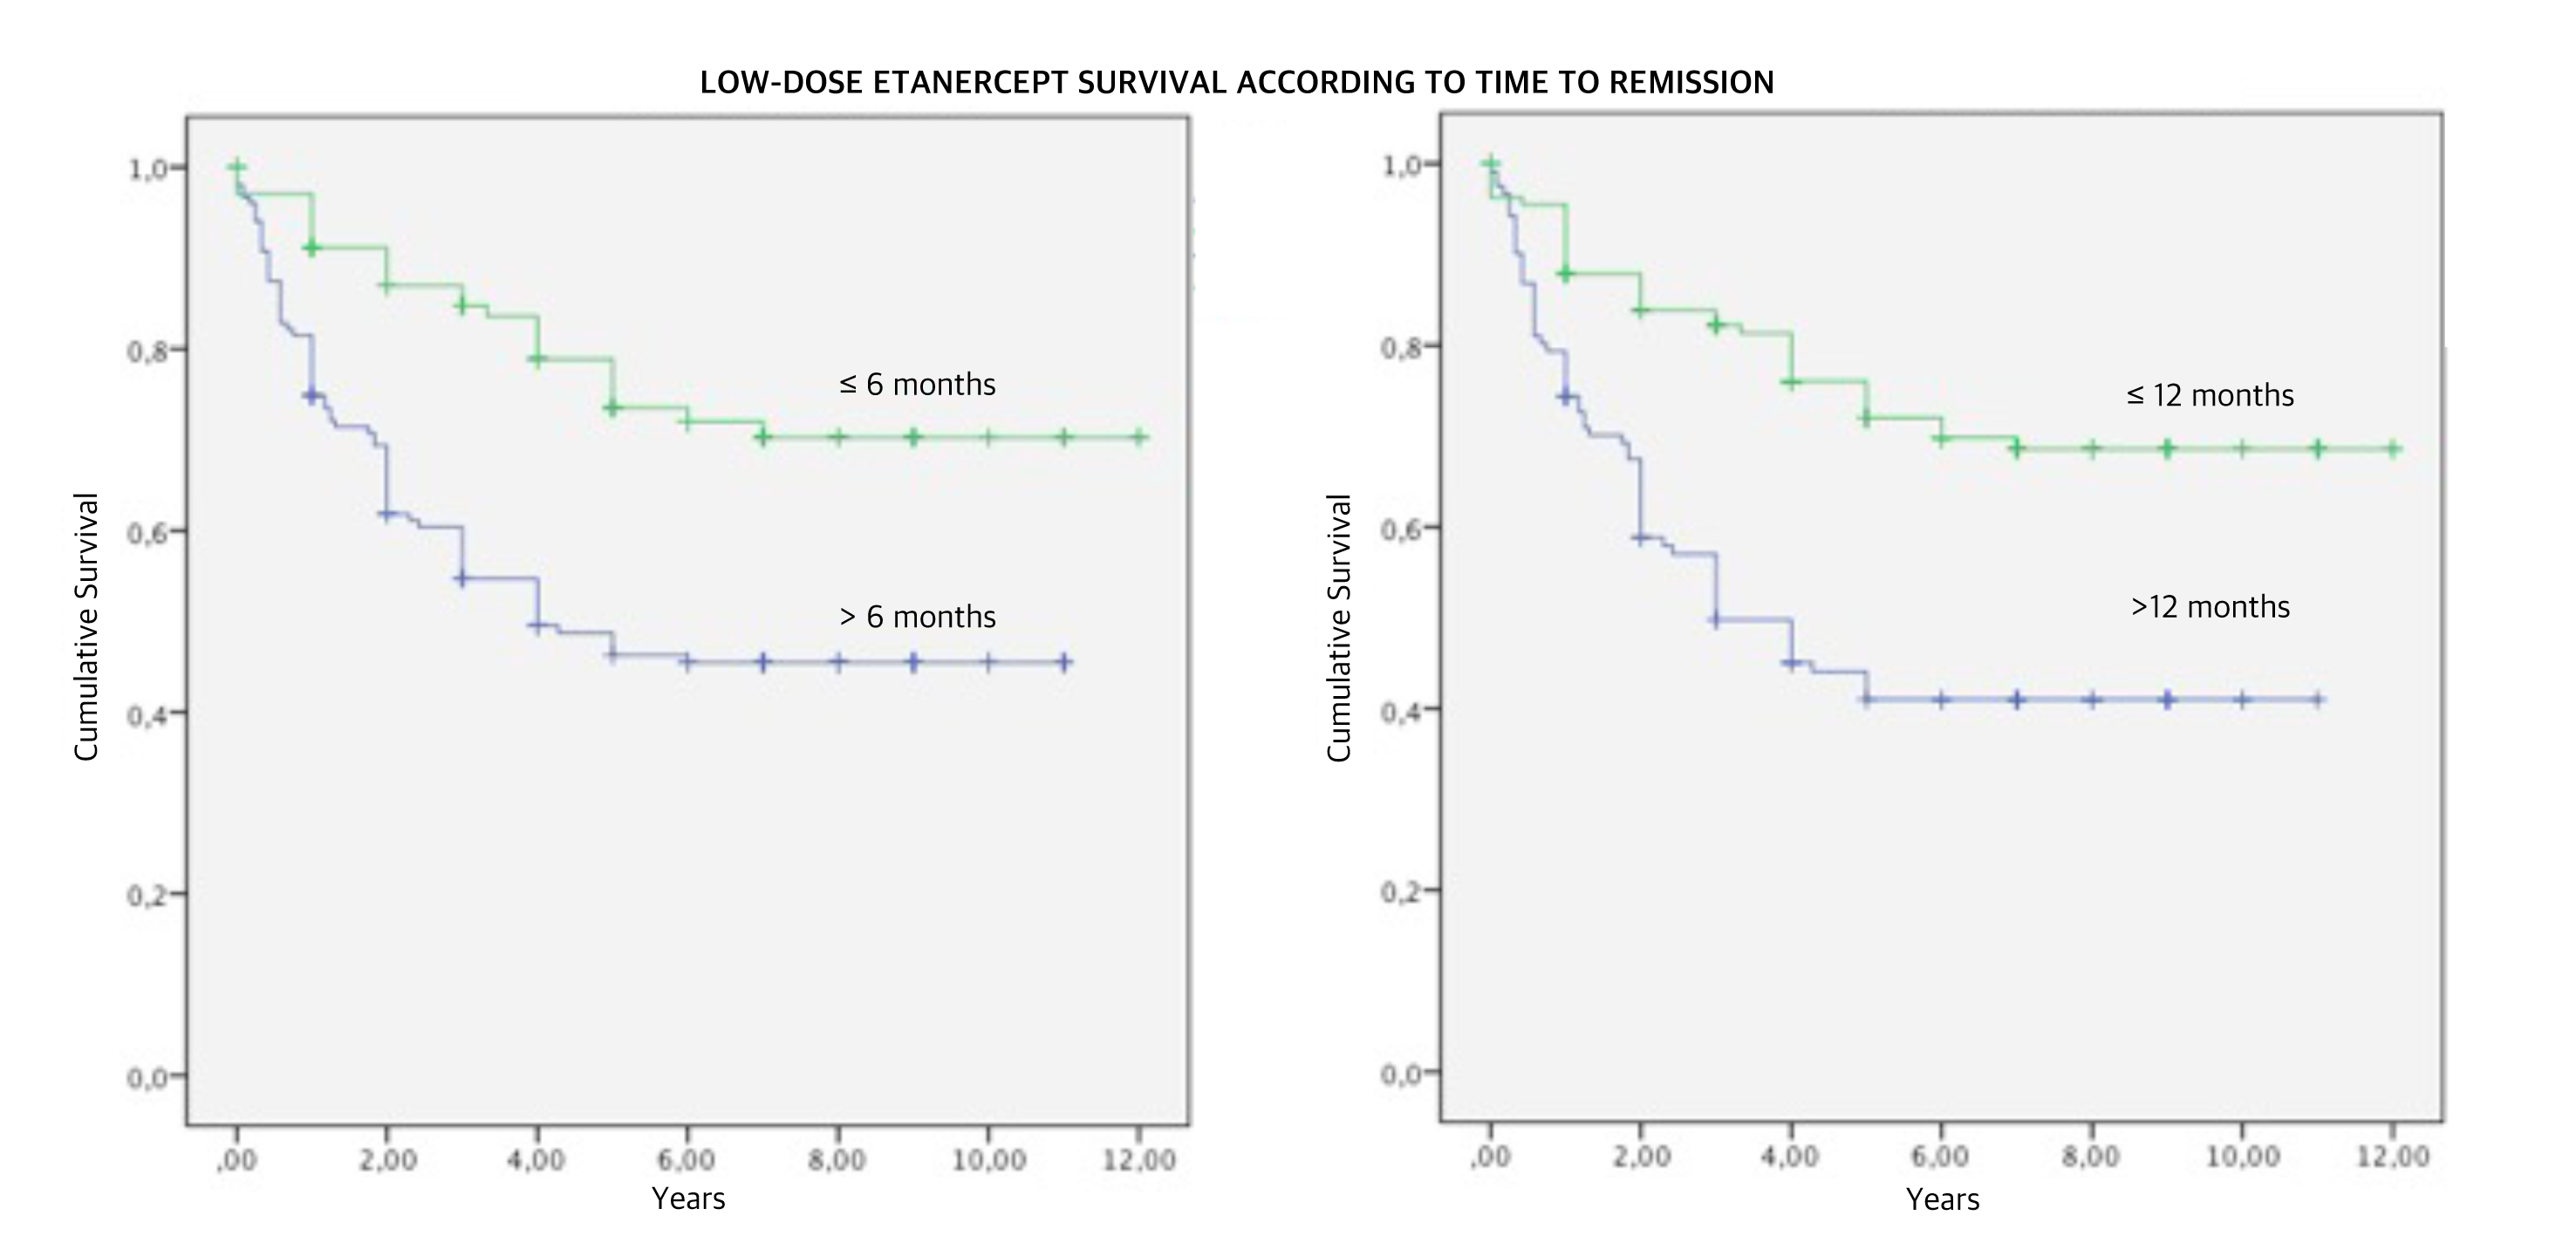
Results: Among 532 patients, 276 were excluded because of missing data or because they were lost to follow-up leaving 256 patients eligible. After 11.28±4.05 years, 50/256 (19.5%) returned to full dose because of disease relapse, 55/256 (21.5%) stopped the treatment with ETN, and 151/256 (59.0%) maintained low-dose. TTR<=6 months and TTR<=12 months resulted significant predictors of low-dose survival (OR 1.93, 95% C.I. 1.31-2.85, p=0.001 and OR 3.11, 95% C.I. 2.06-4.68; p<0.001, respectively) together with a lower mean prednisone daily dose (Table II, Figure 1).
Conclusion: A shorter TTR and a lower mean prednisone daily dose are predictors of long-term survival of low-dose ETN. TTR<=6 months and TTR<=12 months are associated with a 2-fold and 3-fold increased probability of low-dose ETN survival respectively.
| Table I. Characteristics of the patents according to the maintenance of half-dose etanercept. | ||||
| Univariate Analysis | ||||
| All patients | Low-dose survival | Low-dose failure | p value | |
| Number | 256 | 151 | 105 | |
| Patients who stopped etanercept t, n (%) | 55 (21.5) | – | 55 (52.4) | – |
| Patients who returned to full-dose etanercept, n (%) | 50 (19.5) | – | 50 (47.6) | – |
| Age, median (IQR), years | 59.00 (49.00;67.00) | 60.00 (50.00;68.00) | 58.00 (47.00;66.50) | 0.266 |
| Females, n (%) | 217 (84.8) | 126 (83.4) | 91 (86.7) | 0.301 |
| Positive RF orACPA, n (%) | 164 (64.6) | 101 (67.3) | 63 (60.6) | 0.165 |
| Disease duration, median (IQR), years | 15.00 (9.25;21.00) | 14.00 (9.00;21.00) | 15.00 (10.00;22.00) | 0.510 |
| Etanercept treatment duration, median (IQR), years | 8.00 (5.00;10.00) | 8.00 (5.00;10.00) | 7.00 (5.00;10.00) | 0.177 |
| Low-dose etanercept treatment duration, median (IQR), years | 4.00 (1.27;8.00) | 7.00 (4.00;9.00) | 1.75 (0.58;3.00) | <0.001 |
| Mean prednisone daily dose, median (IQR), mg | 2.50 (0.00;5.00) | 2.50 (0.00;5.00) | 5.00 (2.50;5.00) | 0.011 |
| Combination with methotrexate or leflunomide, n (%) | 129 (50.4) | 78 (51.7) | 51 (48.6) | 0.360 |
| Baseline DAS28, median (IQR) | 5.17 (4.50;5.53) | 5.20 (4.48;5.47) | 5.08 (4.68;5.65) | 0.646 |
| Baseline C-reactive protein, median (IQR), mg/L | 12.00 (6.00;25.00) | 12.00 (6.00;22.00) | 12.65 (5.00;31.50) | 0.491 |
| Time to remission, median (IQR), years | 0.50 (0.08;1.56) | 0.25 (0.08;0.83) | 1.17 (0.08;2.88) | <0.001 |
| Time to remission <=6 months, n (%) | 167 (65.2) | 110 (72.8) | 57 (52.3) | 0.002 |
| Time to remission <=12 months, n (%) | 200 (78.1) | 134 (88.7) | 66 (62.9) | <0.001 |
| Table II. Survival of low-dose etanercept according to time to remission: results of Cox regression analysis. | |||||
|
Model I |
Model II |
||||
|
Time to remission ² 6 months |
Time to remission ² 12 months |
||||
|
OR (95% CI) |
p value |
OR (95% CI) |
p value |
||
| Positive RF or ACPA |
0.84 (0.56;1.25) |
0.382 |
0.92 (0.62;1.37) |
0.677 |
|
| Mean prednisone daily dose | per milligram increase |
1.13 (1.04;1.23) |
0.004 |
1.12 (1.03;1.21) |
0.010 |
| Time to remission <=6 months |
|
1.93 (1.31;2.85) |
0.001 |
– |
– |
| Time to remission <=12 months |
|
– |
– |
3.11 (2.06;4.68) |
<0.001 |
Figure 1. Low-dose etanercept survival according to time to remission. 
To cite this abstract in AMA style:
Ometto F, Raffeiner B, Botsios C, Astorri D, Friso L, Bernardi L, Punzi L, Doria A. Predictors of Long Term Survival of Low-Dose Etanercept: An Observational Study [abstract]. Arthritis Rheumatol. 2016; 68 (suppl 10). https://acrabstracts.org/abstract/predictors-of-long-term-survival-of-low-dose-etanercept-an-observational-study/. Accessed .« Back to 2016 ACR/ARHP Annual Meeting
ACR Meeting Abstracts - https://acrabstracts.org/abstract/predictors-of-long-term-survival-of-low-dose-etanercept-an-observational-study/
