Session Information
Date: Sunday, November 13, 2022
Title: RA – Treatment Poster II
Session Type: Poster Session B
Session Time: 9:00AM-10:30AM
Background/Purpose: Analyses of methotrexate polyglutamates (MTX-PGs) in red blood cells (RBCs) has been employed as tool for personalized therapy approach for RA patients during MTX therapy. However, rather than RBCs, peripheral blood mononuclear cells (PBMCs) represent the fraction of immune-effector cells primarily targeted by MTX. Thus far, no prospective study has been performed measuring MTX-PG levels in PBMCs vs RBCs in the early phase of MTX treatment. Here, we investigated the pharmacokinetics of MTX-PG accumulation in RBCs and PBMCs in newly diagnosed RA patients in the early phase (1, 2, 3 and 6 months) of oral and subcutaneous MTX treatment and its relationship with disease activity.
Methods: In a clinical prospective cohort study (Methotrexate Monitoring (MeMo) study), newly diagnosed RA patients (n=46, mean DAS28: 3.5) were randomized for oral or subcutaneous MTX as described before [1]. At 1, 2, 3 and 6 months after start of therapy, blood was collected and RBCs and PBMCs isolated. MTX-PG1-6 concentrations were analyzed using a validated UPLC-MS/MS method with stable isotopes of MTX-PG1-6 as internal standards [2].
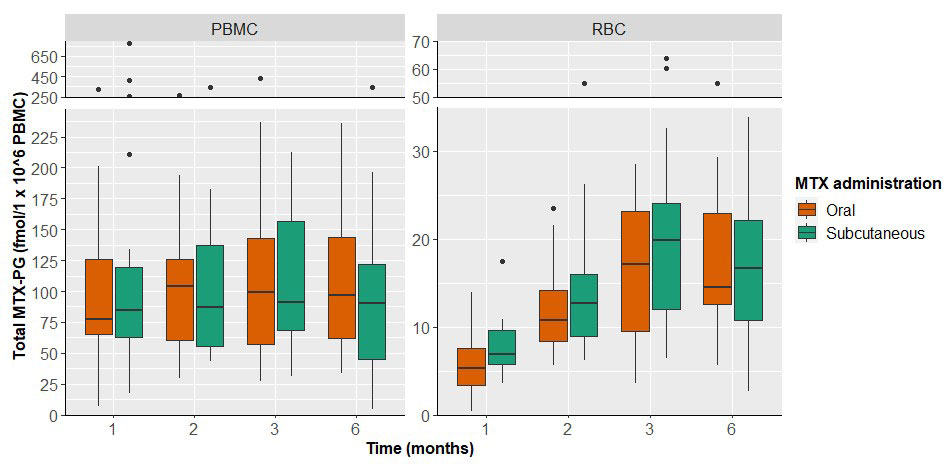
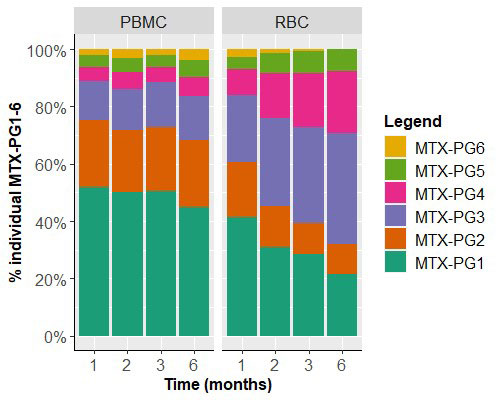
Results: PBMCs and RBCs revealed a disparate profile in both absolute MTX-PG accumulation levels and distribution profile (Fig 1&2). Total intracellular MTX-PG1-6 accumulation in PBMCs was significantly (p< 0.001) 10-20-fold higher than RBCs at all time points, regardless of the administration route (Fig 1). MTX-PG distribution in PBMCs was for 85-90% composed of short chain MTX-PG1-3 (PG1>PG2>PG3) and a remainder fraction of MTX-PG4-6. Remarkably, the distribution profile in PBMCs remained constant over a period of 6 months (Fig 2). This profile is distinct from the profile in RBCs. Irrespective of the administration route (without corrections for covariates), RBCs contained mainly MTX-PG1 and lower levels of MTX-PG2-5 at 1 month after therapy start. (Results of a multivariate model of MTX-PGs in RBCs in this cohort have been published before [1].) After 3 months of therapy, MTX-PG3 was the main PG-moiety in RBCs. This profile is largely retained after 6 months of MTX therapy. Conceivably, the disparate MTX-PG accumulation and distribution profiles in PBMCs versus RBCs of RA patients may be associated with the shorter life span of PBMCs and their higher enzymatic activity of folylpolyglutamate synthetase, which is responsible for the conversion of MTX to MTX-PGs [3]. Based on EULAR response criteria, MTX-responding patients had higher MTX-PG3 (data not shown) and total RBC MTX-PG levels compared with non-responders (univariate linear mixed effects models, β 0.006, 95% CI 0.00-0.12, p=0.040, Fig 3). This was not seen in PBMCs (data not shown).
Conclusion: Newly diagnosed RA patients starting MTX therapy accumulated significantly 10-20 fold higher MTX-PG concentrations in PBMCs than in RBCs over a period of 6 months, independent of the administration route.MTX-PG distribution profiles differed between PBMC (highest MTX-PG1) and RBCs (highest MTX-PG3).
References:[1] R Hebing et al, Arthritis Rheum (2021):73(Suppl 10); [2] E den Boer et al, Anal Bioanal Chem (2013);405:1673-81; [3] I Muller et al, Ther Drug Monit (2019);41:598-606.
To cite this abstract in AMA style:
Hebing R, Lin M, Mahmoud S, Muller I, Heil S, Griffioen P, Struys E, Lems W, van den Bemt B, Nurmohamed M, Jansen G, De Jonge R. Methotrexate Therapy Results in Disparate Methotrexate Polyglutamate Profiles in Peripheral Blood Mononuclear Cells Compared with Erythrocytes [abstract]. Arthritis Rheumatol. 2022; 74 (suppl 9). https://acrabstracts.org/abstract/methotrexate-therapy-results-in-disparate-methotrexate-polyglutamate-profiles-in-peripheral-blood-mononuclear-cells-compared-with-erythrocytes/. Accessed .« Back to ACR Convergence 2022
ACR Meeting Abstracts - https://acrabstracts.org/abstract/methotrexate-therapy-results-in-disparate-methotrexate-polyglutamate-profiles-in-peripheral-blood-mononuclear-cells-compared-with-erythrocytes/


