Session Information
Session Type: Poster Session C
Session Time: 10:30AM-12:30PM
Background/Purpose: Lupus nephritis (LN) is a highly morbid condition with a pleomorphic presentation and fluctuating activity. Proteinuria is a typical manifestation of renal involvement, crucial for LN diagnosis, guiding renal biopsy and inferring histological class. It serves as a biomarker for therapeutic response and a prognostic indicator for renal function preservation
The protein-creatinine Ratio (PCR) is a widely used method to estimate the amount of total proteinuria using a urine sample, being used as a substitute for the 24-hour urine collection.
There are no recent reviews suggesting that the 24-hour urine collection for protein measurement should be universally preferred over the PCR from a urine sample. Both methods have their advantages and limitations.
Methods: Urine samples were collected from all patients over 24 hours, and also at four pre-established time points – noon (S1), 6pm (S2), midnight (S3), and 6am (S4) during the same period. PCR measurements were obtained in each of the samples, and then compared to the 24-hour urine volume using Pearson correlation coefficient. PCR values variation was also calculated among all patients at each time point and for each patient across different samples.
Results: When comparing the 24-hour urine proteinuria values with the PCR at each time point a strong correlation in the mean values of the measurements was noted, with p-values of 0.801 for S1, 0.836 for S2, 0.801 for S3, and 0.859 for S4.
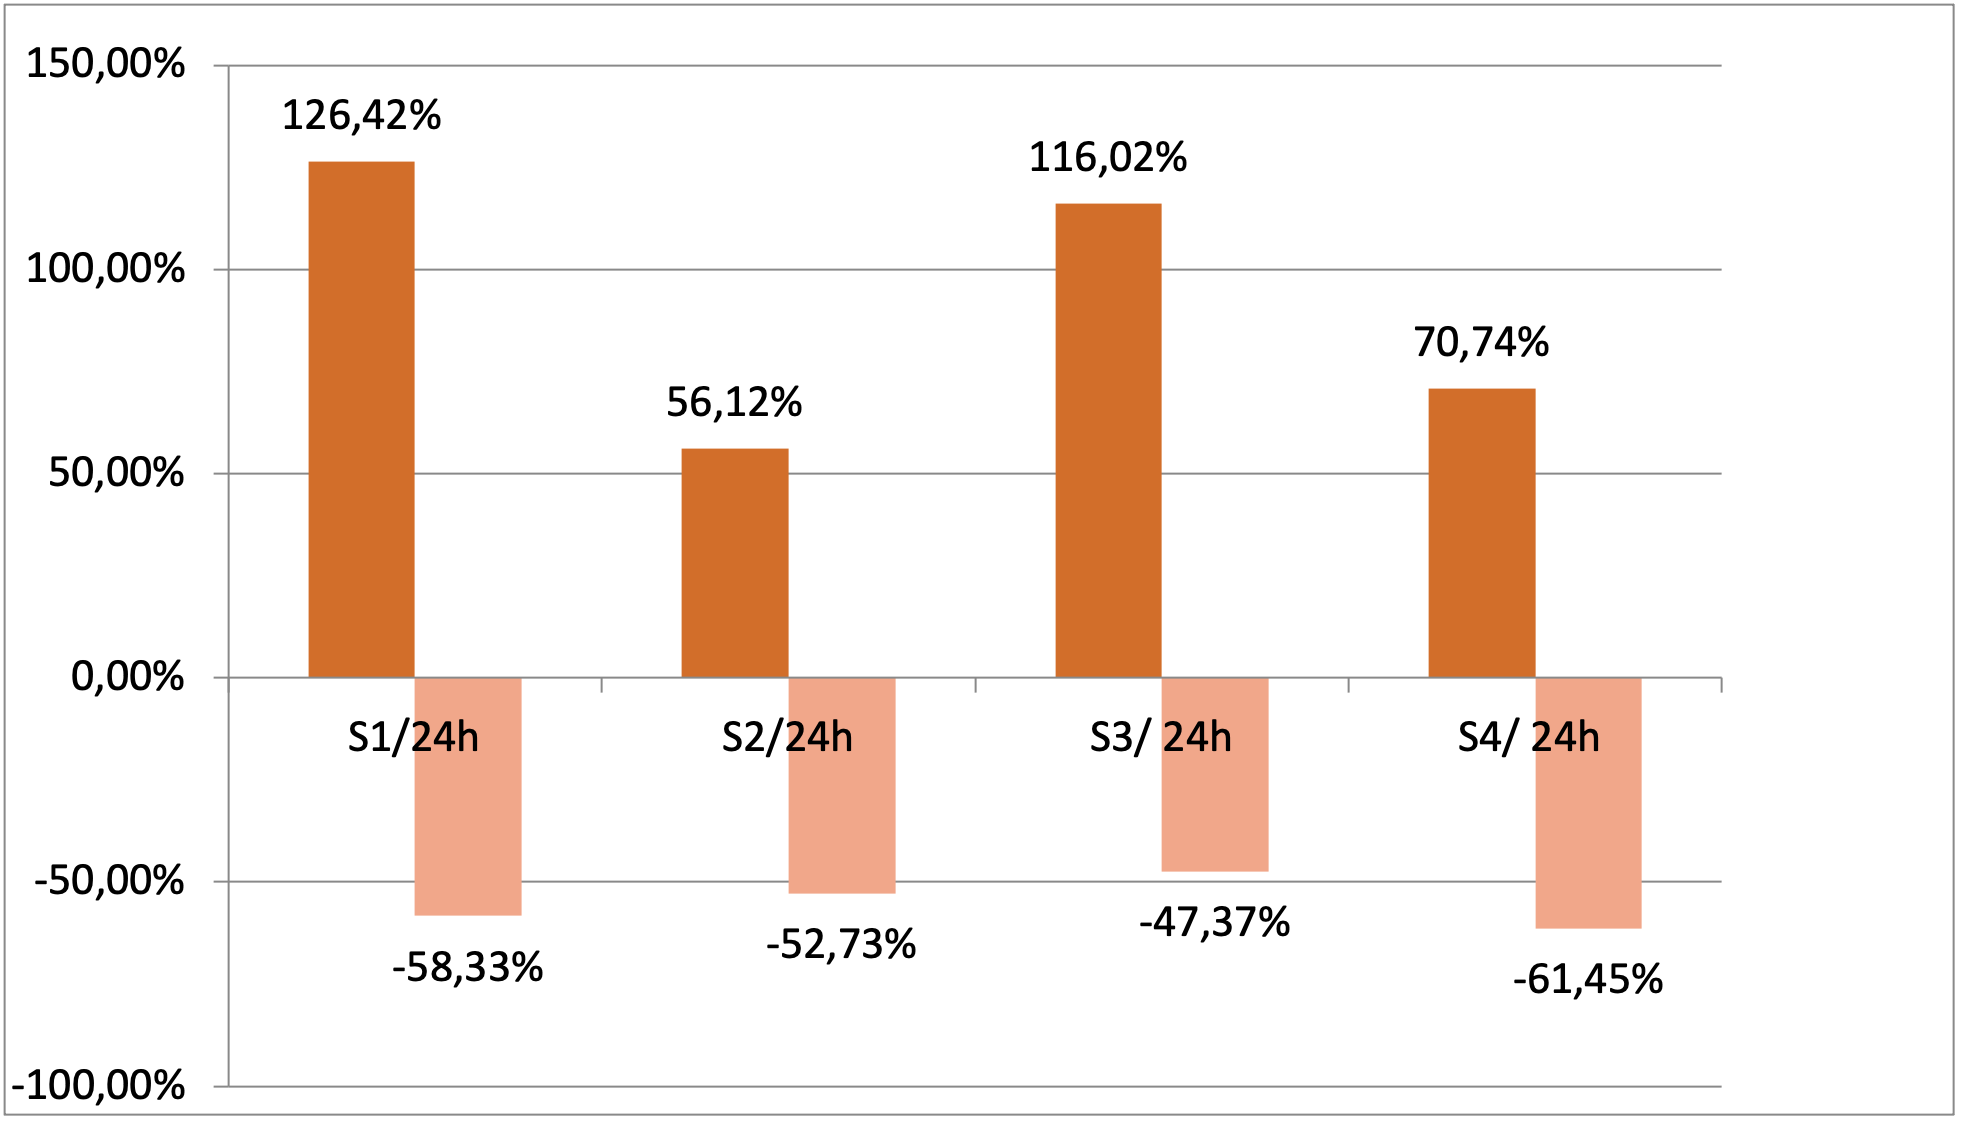
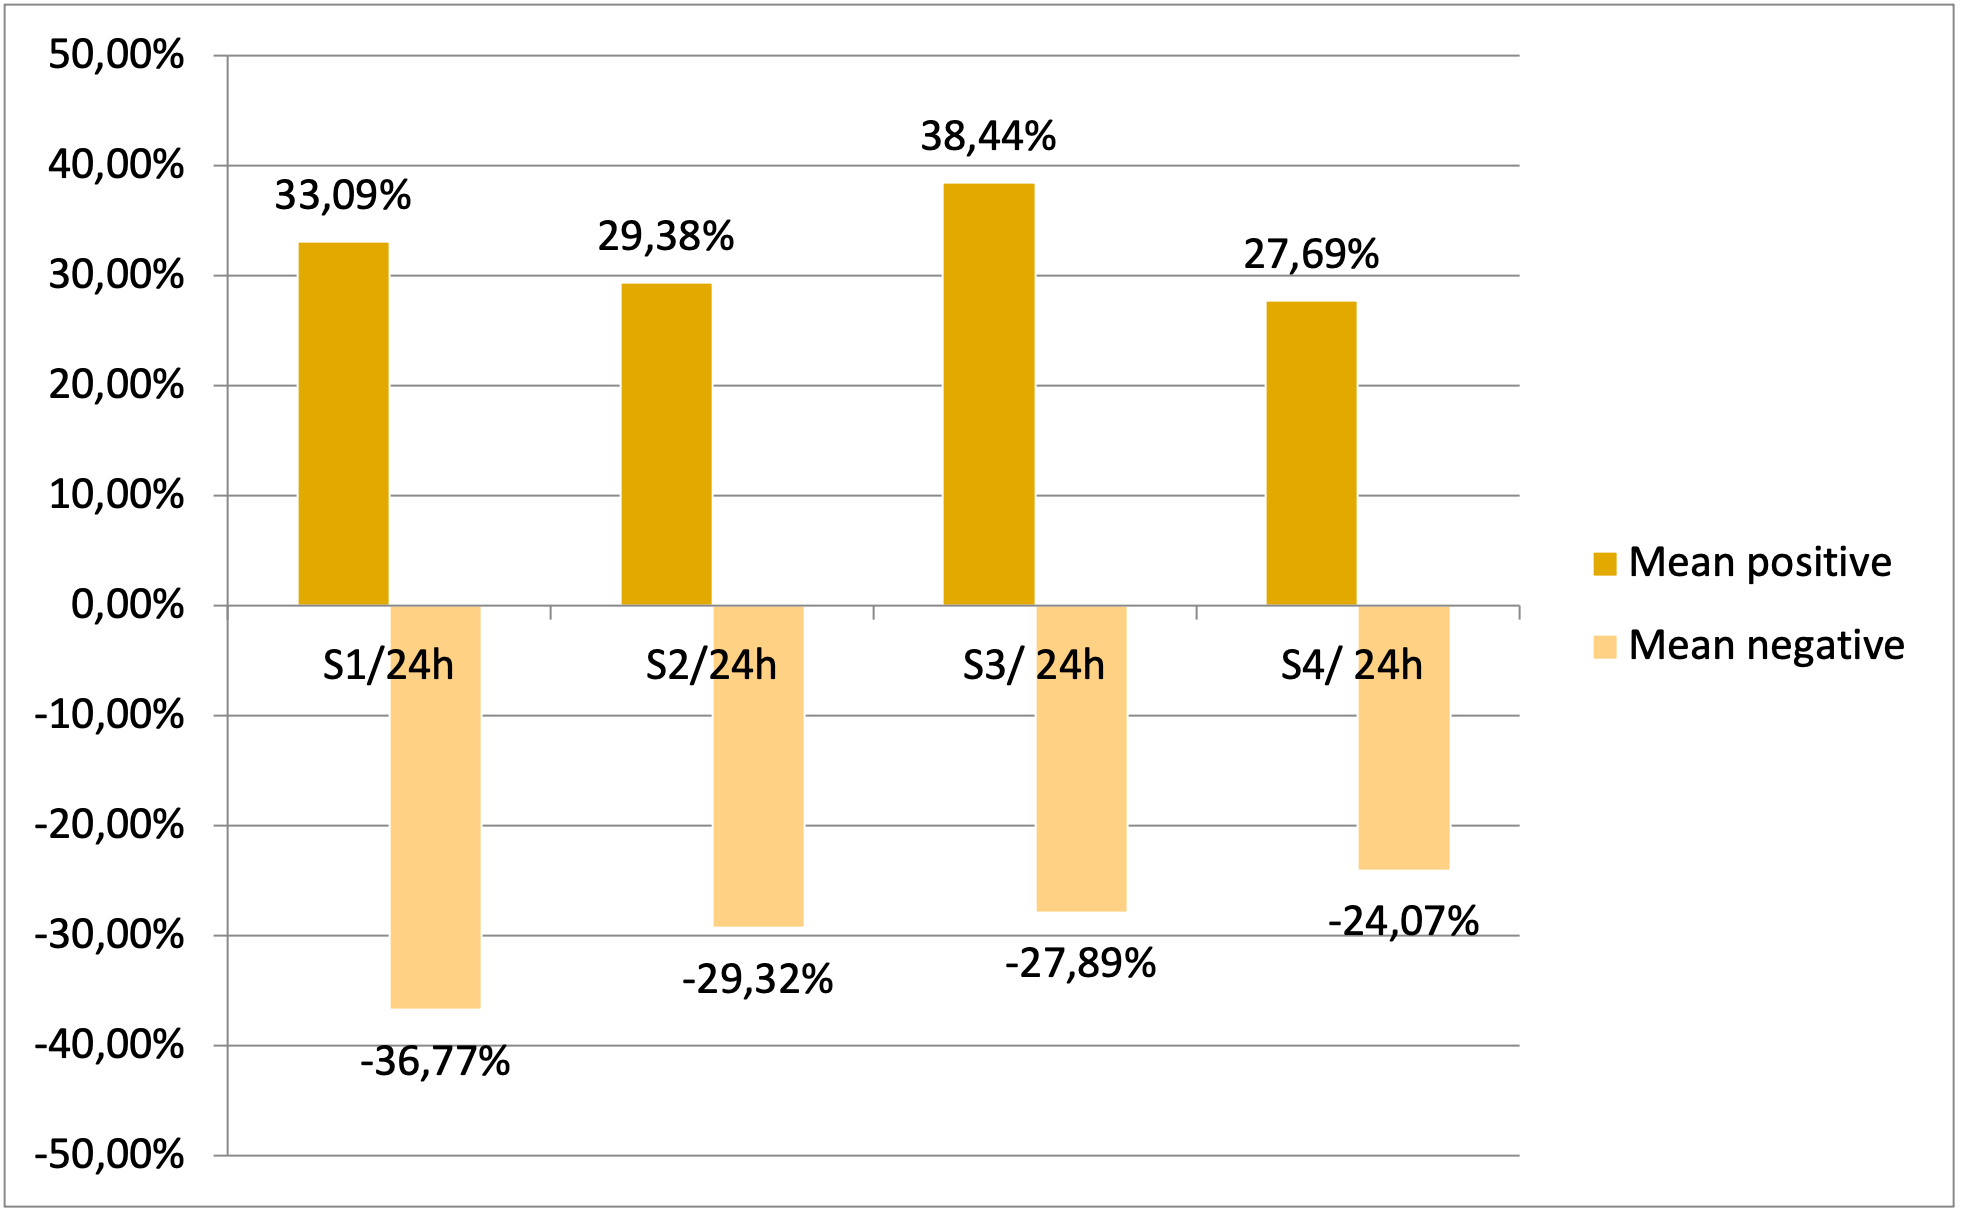
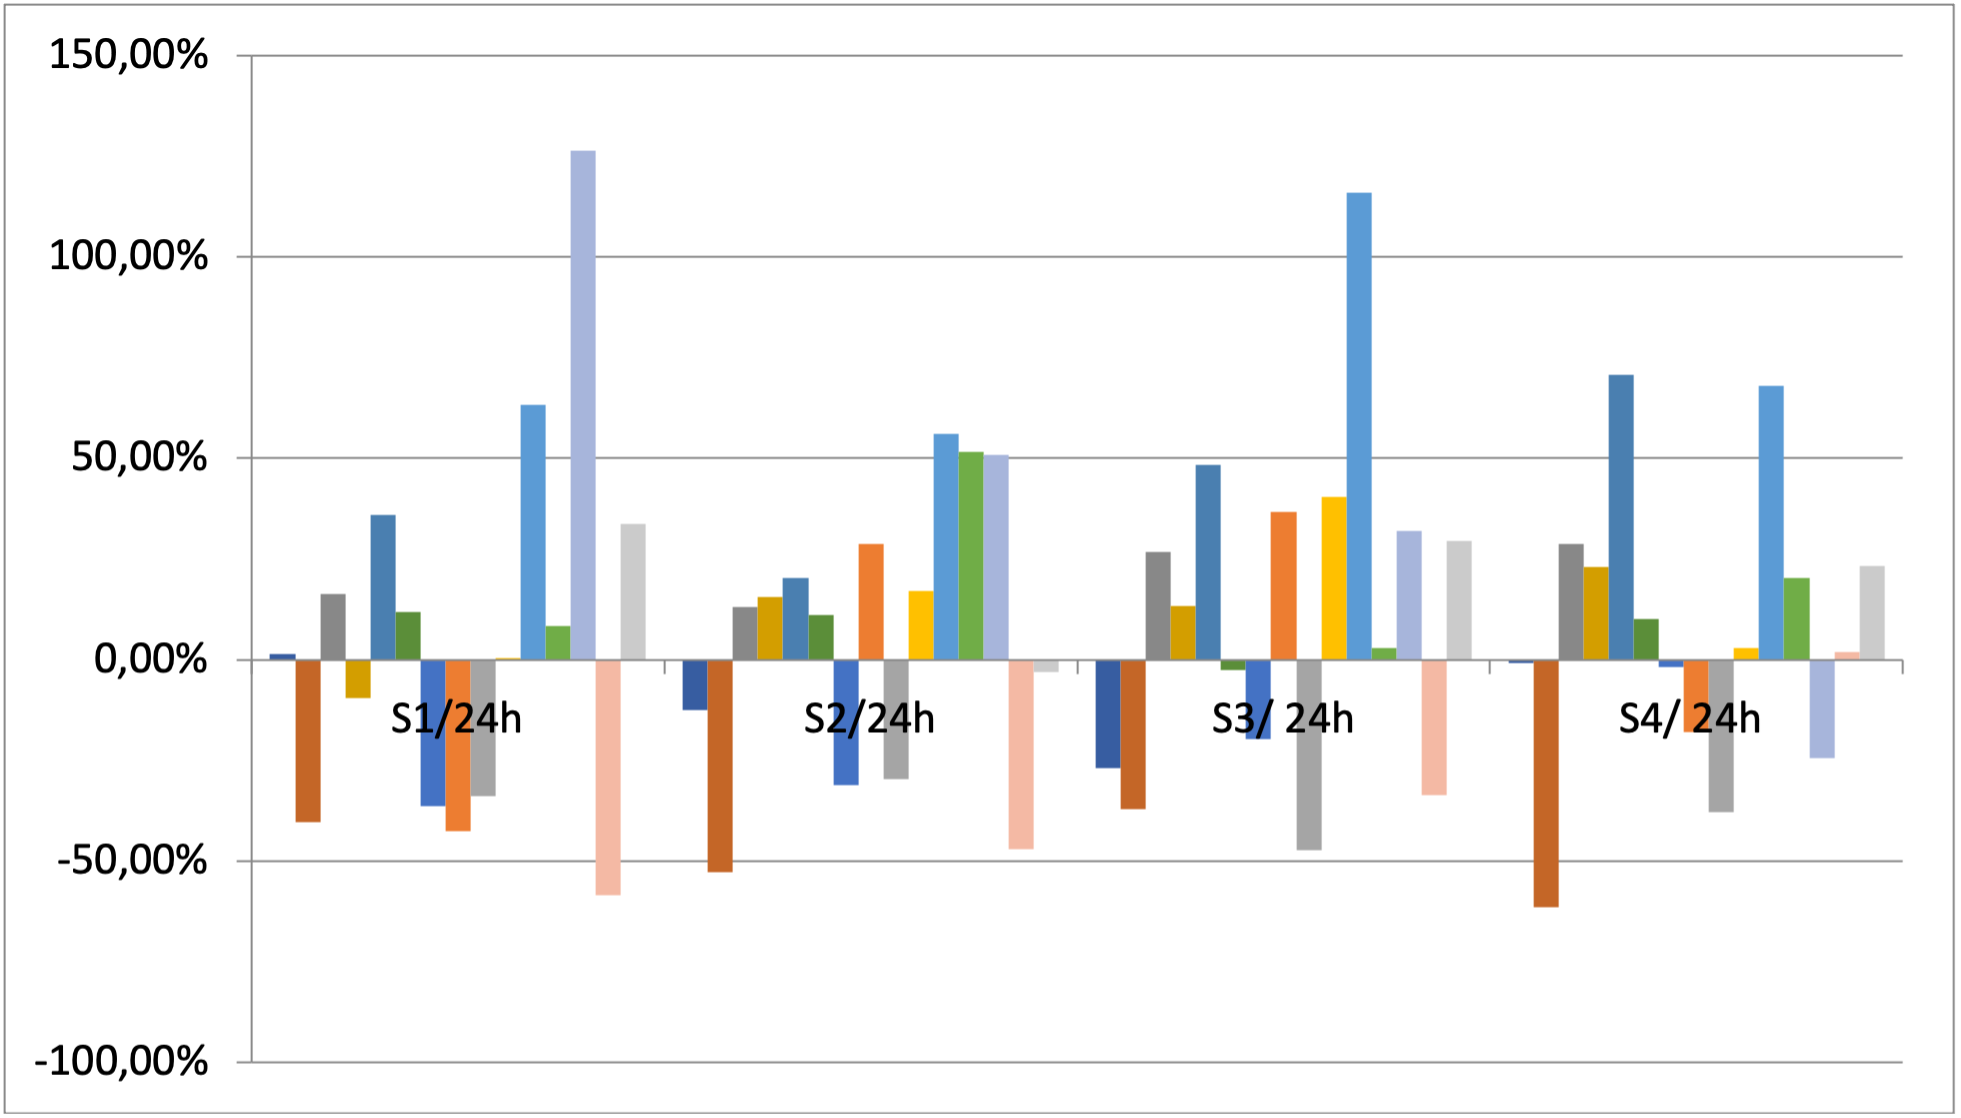
Regardless the strong correlation, a significant variation among the time points was observed, giving a variation range (compared to the 24h proteinuria) of -58,33% to 126,42% for S1, -52,73% to 56,12% for S2, -47,37% to 116,02% for S3 and -61,45% to 70,74% to S4 (picture 1), with a mean value ranging from -33,77% to 33,09% for S1, -29,32% to 29,38% for S2, -27,89% to 38,44% for S3, -24,07% to 27,69% for S4 (picture 2). The smallest variation was observed in S2. The variation of each patient for each sample is shown in picture 3 (each color represents a patient).
Conclusion: The strong correlation (r≈0.8) between mean PCR values at each time point and the 24-hour sample does not accurately represent individual proteinuria. PCR estimates could be significantly higher (+126.42%) or lower (-61.45%) than the 24-hour proteinuria. These data suggest that multiple PCR urine samples may reduce variation for a specific patient, but 24-hour urine collection remains a more accurate proteinuria evaluation.
To cite this abstract in AMA style:
Freitas Ribeiro A, Klumb E, Gonçalves Rodrigues R, Camacho Junior R, Bastos F, Lizarralde M, de Oliveira R, Aguiar Filho R. Is Urinary Protein-creatinine Relation Reliable for Diagnosis or Follow up of Lupus Nephritis? [abstract]. Arthritis Rheumatol. 2024; 76 (suppl 9). https://acrabstracts.org/abstract/is-urinary-protein-creatinine-relation-reliable-for-diagnosis-or-follow-up-of-lupus-nephritis/. Accessed .« Back to ACR Convergence 2024
ACR Meeting Abstracts - https://acrabstracts.org/abstract/is-urinary-protein-creatinine-relation-reliable-for-diagnosis-or-follow-up-of-lupus-nephritis/


